Figure 2.
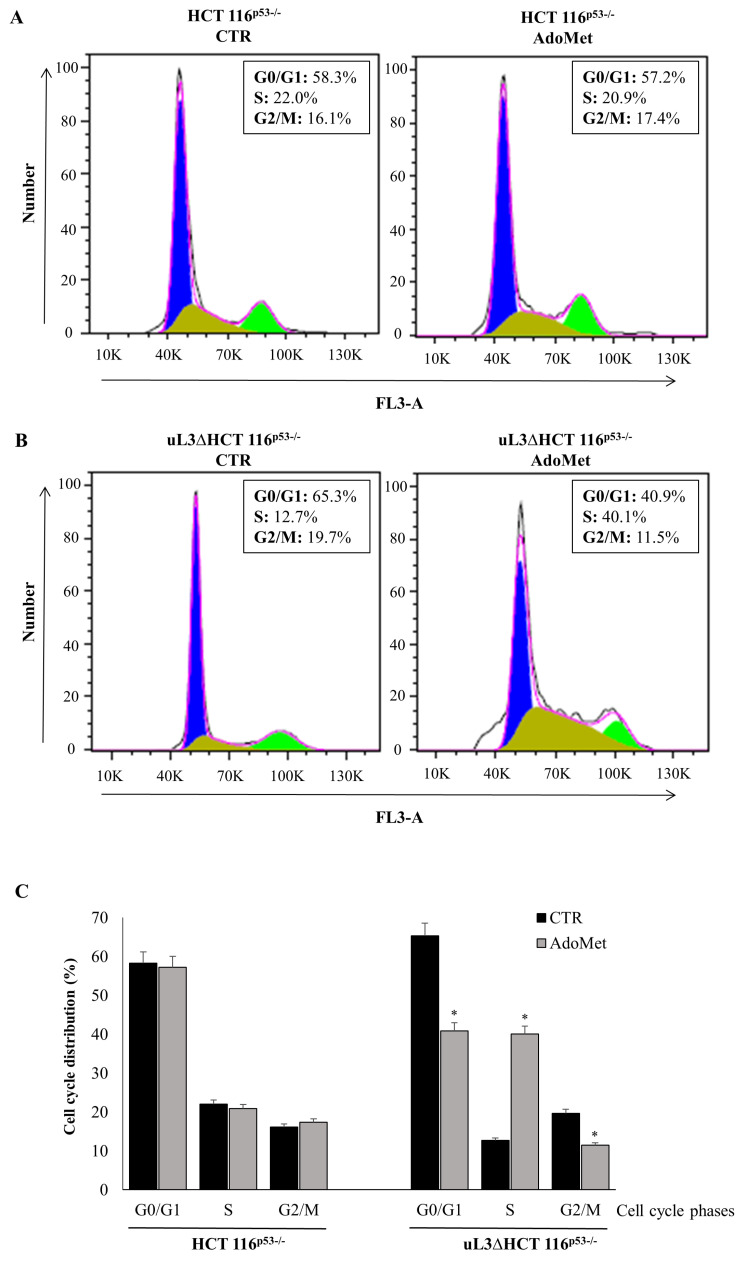
Effect of AdoMet on cell cycle in HCT 116p53−/− and uL3ΔHCT 116p53−/− colon cancer cells. Representative FACS histograms of propidium iodide (PI)-stained of HCT 116p53−/− (A) and uL3ΔHCT 116p53−/− (B) cells treated or not (CTR) with 500 µM AdoMet for 72 h. (C) The bar diagram shows the percentage of cells in each phase of the cell cycle. Each bar represents the mean of triplicate experiments; error bars represent the standard deviation. For each sample, at least 2 × 10⁴ events were analyzed. * p < 0.05 versus untreated cells.

