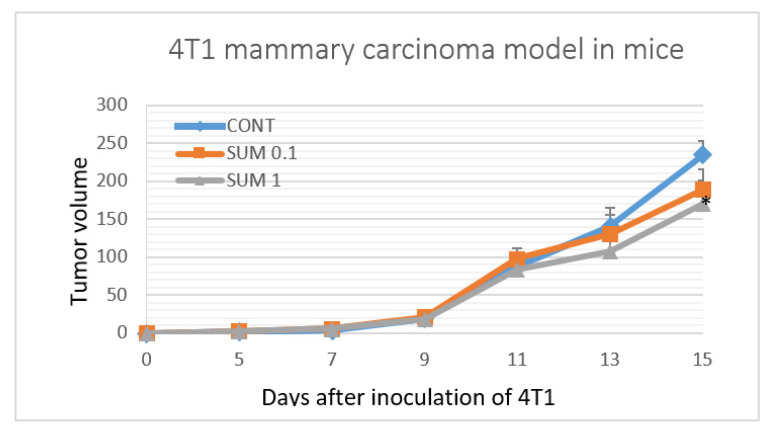
Figure 2.
CONT—control group, SUM 0.1—group with administered sumac at a concentration of 1 g/kg in diet, SUM 1—group with administered sumac at a concentration of 10 g/kg in diet. The development of the volume of 4T1 mammary adenocarcinomas in mice allograft model during the experiment. Data are expressed as mean ± SEM. Significant differences: * p < 0.05 vs. CONT.

