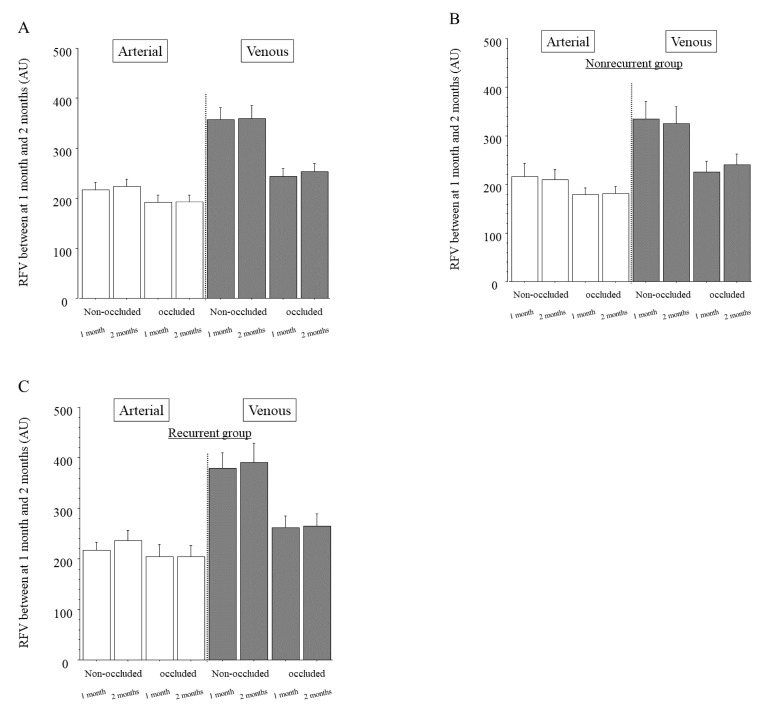
Figure 3.
Relative blood volume between the 1 and 2 month time points after intravitreal ranibizumab injection. (A) In the whole sample, we found no significant differences in relative flow volume (RFV) between 1 and 2 months after intravitreal ranibizumab injection (IRI) in the arteries of the non-occluded and occluded regions (p = 0.575, p = 0.908, respectively). We also found no significant differences in RFV between 1 and 2 months after IRI in the veins of the non-occluded and occluded regions (p = 0.947, p = 0.316, respectively). (B) In the group with no recurrence of macular edema (nonrecurrent group, n = 24), we found no significant differences in RFV between 1 and 2 months after IRI in the arteries and veins of the non-occluded and occluded regions (arteries: p = 0.172, p = 0.996, respectively; veins: p = 0.702, p = 0.784, respectively). (C) In the group with recurrent macular edema (recurrent group, n = 23), we found no significant differences in RFV between 1 month (before the first recurrence) and 2 months (time of recurrence) after IRI in the arteries and veins of the non-occluded and occluded regions (arteries: p = 0.736, p = 0.877, respectively; veins: p = 0.777, p = 0.243, respectively).

