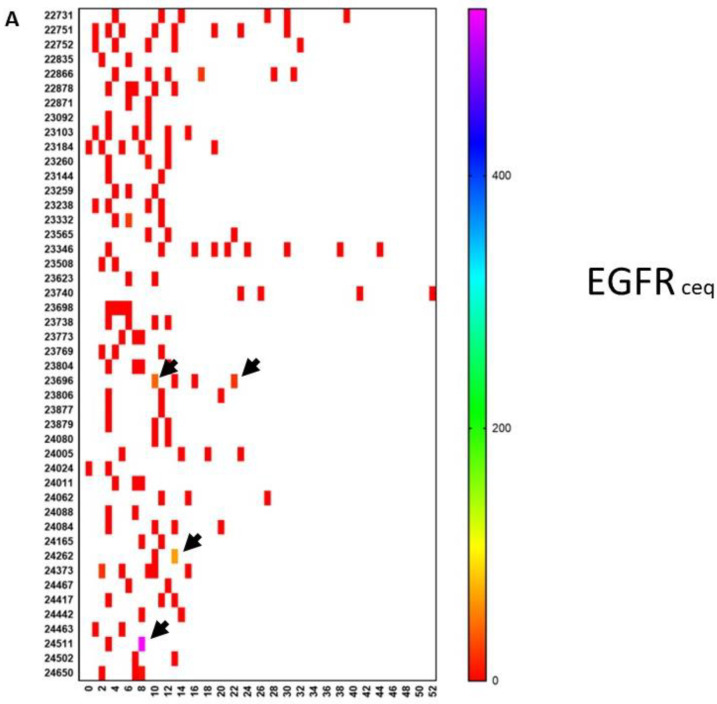
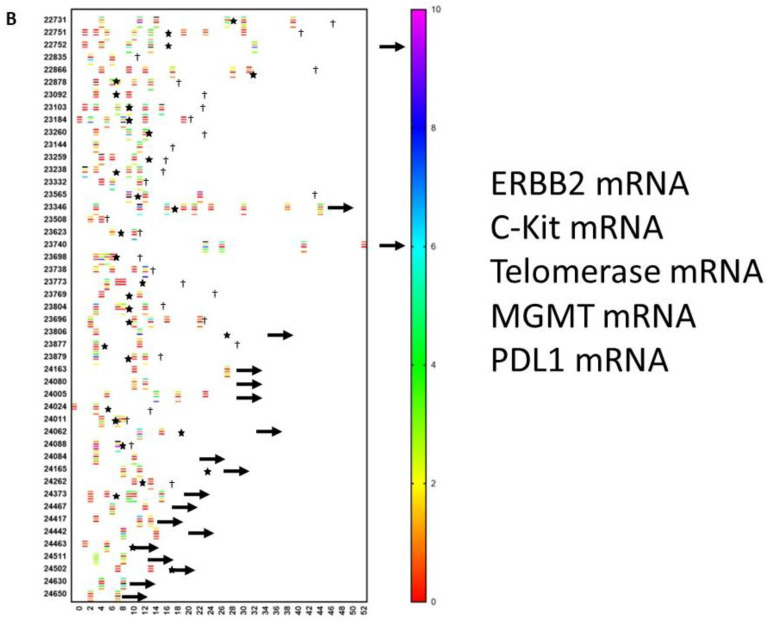
Figure 3.
Evolution of oncogene expression in circulating tumor cells. Circulating tumor cells were measured repetitively in 46 patients. Each patient is referenced with a number on the y-axis. Time in months is indicated on the x-axis. The scale of the color of each test is shown on the right-hand side. (A) The level of mRNA expression for EGFR is expressed as the ceq (cell equivalent). Most of the values are negative (red). However, as indicated by the arrows, some patients showed an upregulation of EGFR during the disease course. (B) This shows a similar data set-up as in panel A. For each patient, data on mRNA expression are relative to the house-keeping gene GADPH and are shown in a particular color, for which the scale is shown on the right-hand side. For each patient, up to five lines are shown at different moments during the disease course. From top to bottom, values for ERBB2, c-Kit, telomerase, MGMT, and PDL1 are shown for each patient. Stars indicate new events. A † indicates when the patient died. An arrow to the right indicates the time at which the patient was censored in the analysis.


