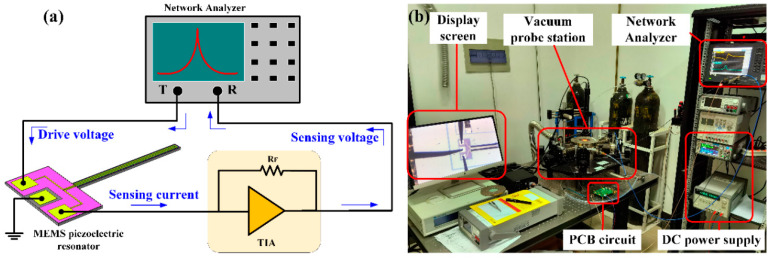
Figure 5.
The schematic of the open-loop electrical measurement setup. (a) The drive voltage generated by a Network Analyzer is applied in the driving electrode (left); the middle electrode connects the ground; then, the sensing current generated in the sensing electrode (right) was fed to the transimpedance amplifier (TIA), which consists of an operational amplifier and a feedback resistance, transforming the current into voltage; finally, the sensing voltage is fed to the Network Analyzer. The Network Analyzer will automatically display the transmission curve, as shown in Figure 6. The blue arrows represent the signal flow; (b) the actual measurement setup, whereby the piezoelectric cantilever is inside the vacuum probe station, which is amplified by the microscope and is shown in the display screen. The black probes in the display screen are sensing, driving, and ground electrode.

