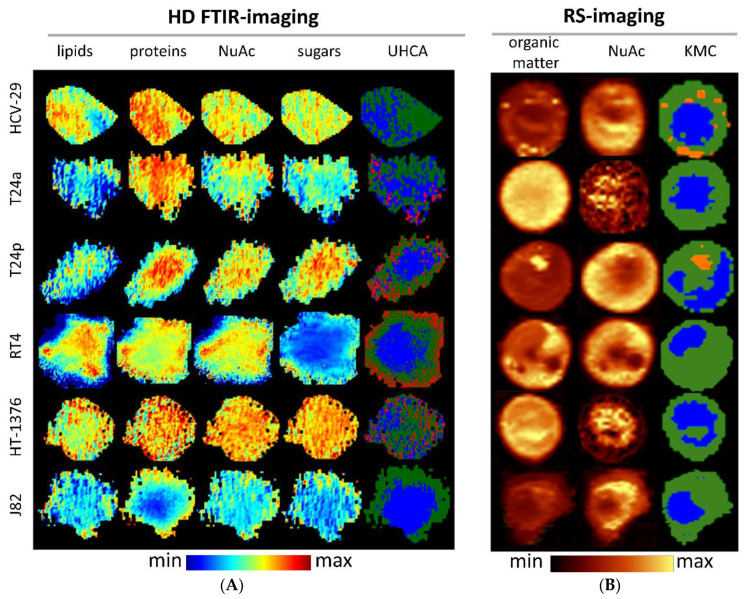
Figure 2.
Examples of HD FTIR (A) and RS images (B) constructed for integral intensities of bands specific for main cellular macromolecules and their clustering into false-color maps (Unsupervised Hierarchical Cluster Analysis (UHCA) and k-means cluster (KMC) for FTIR and Raman images, respectively). The colors in UHCA and KMC cluster maps correspond to nucleus (blue), cytoplasm (green), graininess in cytoplasm (red; present in all 20 cells of the four cell lines except HCV-29 and J82), and lipid droplets (orange; present in 18 out of 20 HCV-29 cells and 17 out of 20 T24p cells). Abbreviations: HD—high definition, NuAc—nucleic acids. Color bars (min–max) denote changes in intensities of bands chosen to construct chemical images.

