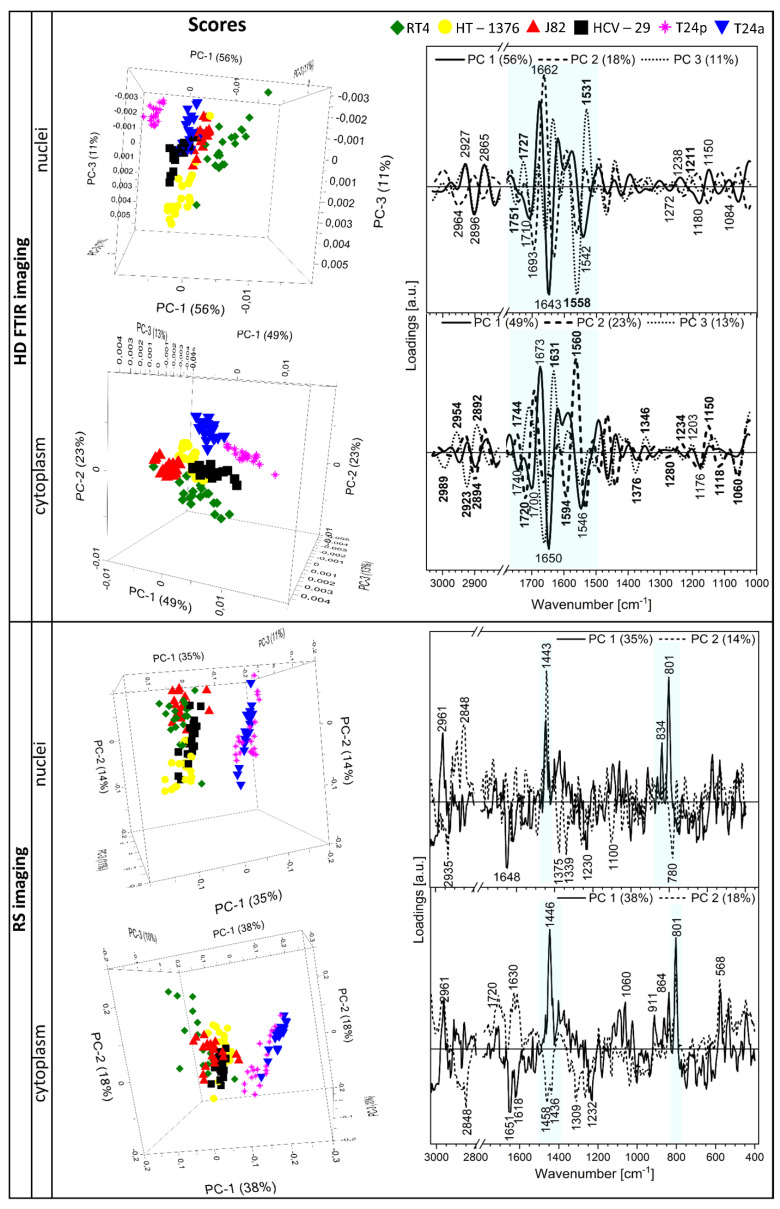
Figure 6.
Three-dimensional PCA score plots for the nuclei and cytoplasm of the cell lines derived from UHCA and KMC analyses of HD FTIR and RS images (left) and their respective loading plots for PC 1–3 (right). Analyses were performed on second derivative FTIR spectra and Raman spectra in the bio-region. The aqua color in the loading plots highlighted the strongest discriminators. The band assignment was summarized in Tables S1 and S2.

