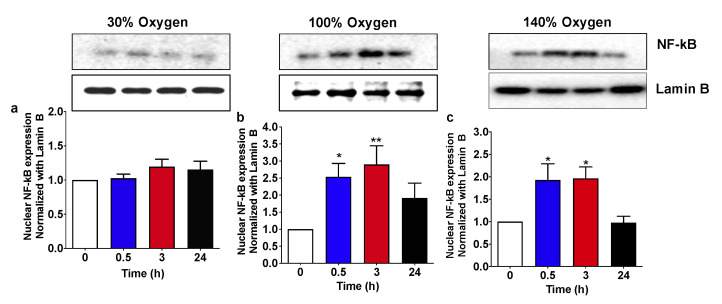
Figure 3.
NF-κB (p65 subunit) nuclear translocation following 1 h hyperoxia. (a) Mild hyperoxia (30% O2); (b) high hyperoxia (100% O2); (c) very high hyperoxia (140% O2) before and after the recovery to normoxic conditions. Above histograms, the picture shows a representative western blot analysis. Results are expressed as fold change (mean ± SEM) in comparison to baseline (0), which was set at 1. * p < 0.05, ** p < 0,01; for one-way ANOVA followed by Dunnett’s post hoc test.

