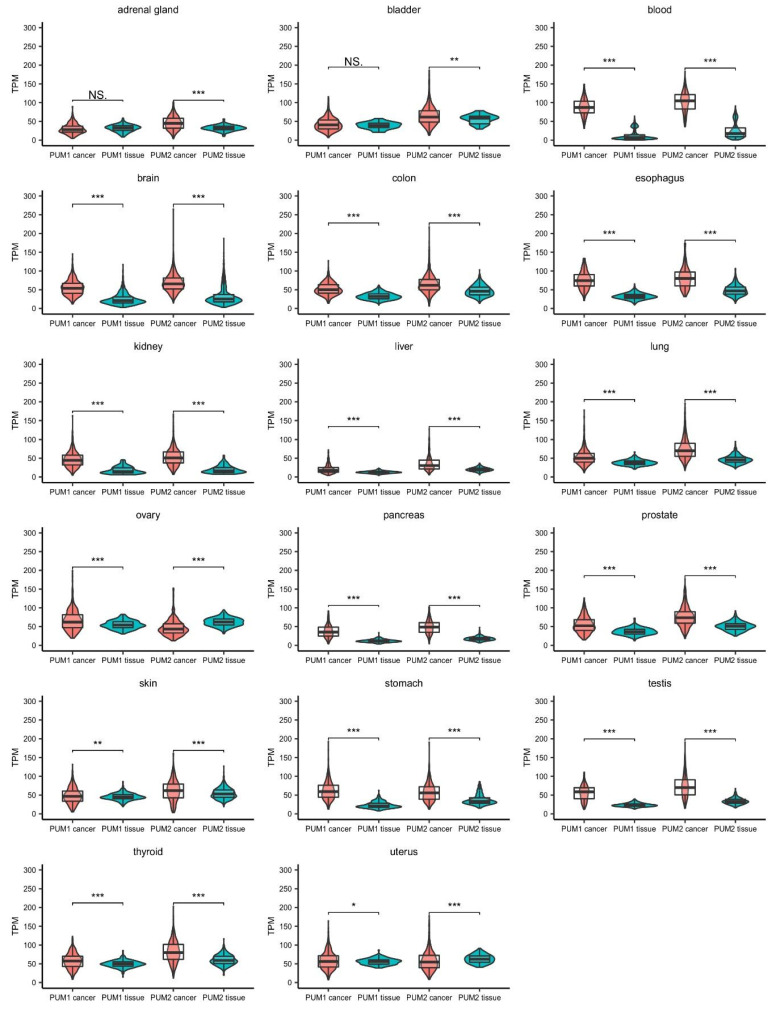
Figure 3.
Comparison of PUM1 and PUM2 RNA expression levels in 17 types of cancers and corresponding healthy tissues. Data were obtained for cancers from The Cancer Genome Atlas (October 2020) (PUM1/2 cancer) and for healthy tissues from the Genotype-Tissue Expression project (October 2020) (PUM1/2 tissue). Statistical significance was calculated using t-tests. Violin-box-whisker plots were generated using ggplot2 library in R. NS—non-significant, TPM—transcript per million (reads), * p < 0.05, ** p < 0.01, *** p < 0.005.

