Figure 1.
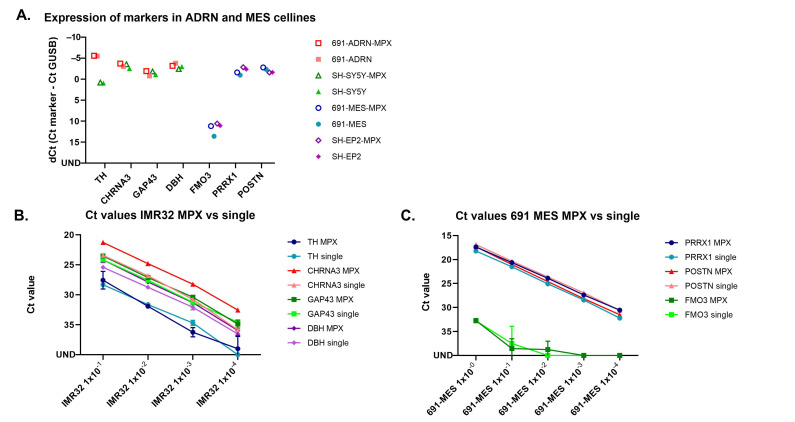
Expression of ADRN and MES panel markers in ADRN and MES cell lines with singleplex and multiplex methods (A) ADRN cell lines 691-ADRN and SH-SY5Y in red and green, respectively. MES cell lines 691-MES and SH-EP2 in blue and purple, respectively. Expression with multiplex method in open symbols, expression with singleplex method in filled symbols. UND = undetermined; (B) Dilution curve of IMR32, ADRN markers tested in MPX and singleplex; (C) Dilution curve of 691-MES, MES markers tested in MPX and singleplex.

