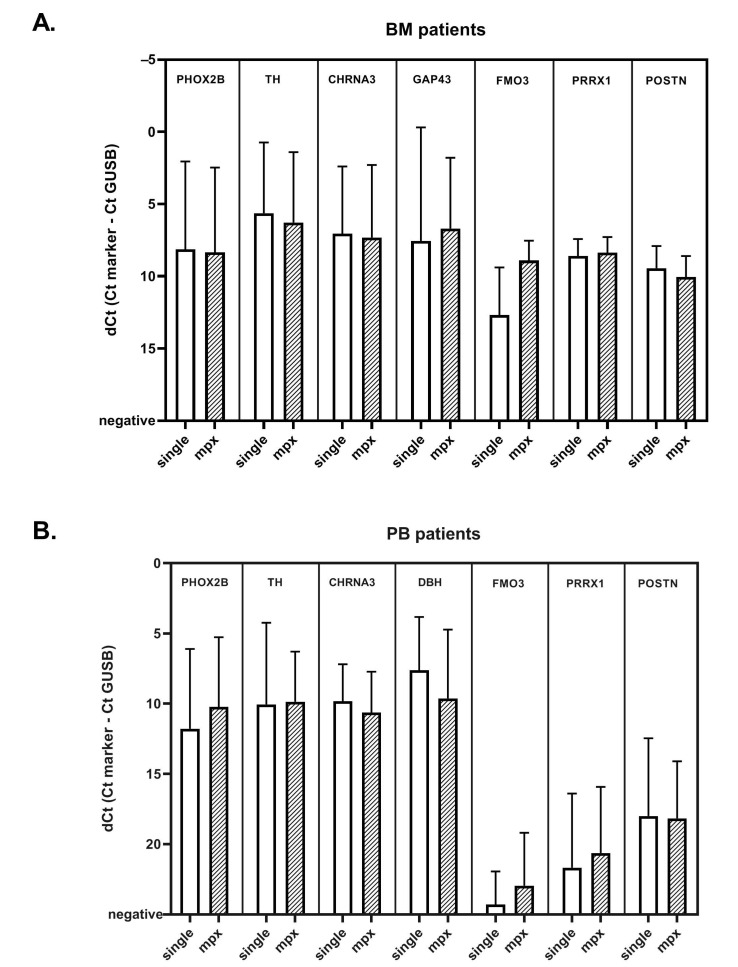
Figure 3.
Mean normalized Ct values in BM (A) and PB (B) of patients with neuroblastoma, for singleplex and multiplex methods. Bar graph showing the mean normalized Ct value (ΔCt = Ctmarker – CtGUSB) for ADRN and MES markers in singleplex and multiplex methods, in A: bone marrow (BM) and B: peripheral blood (PB) samples of patients with neuroblastoma. Whiskers indicate the standard deviation.

