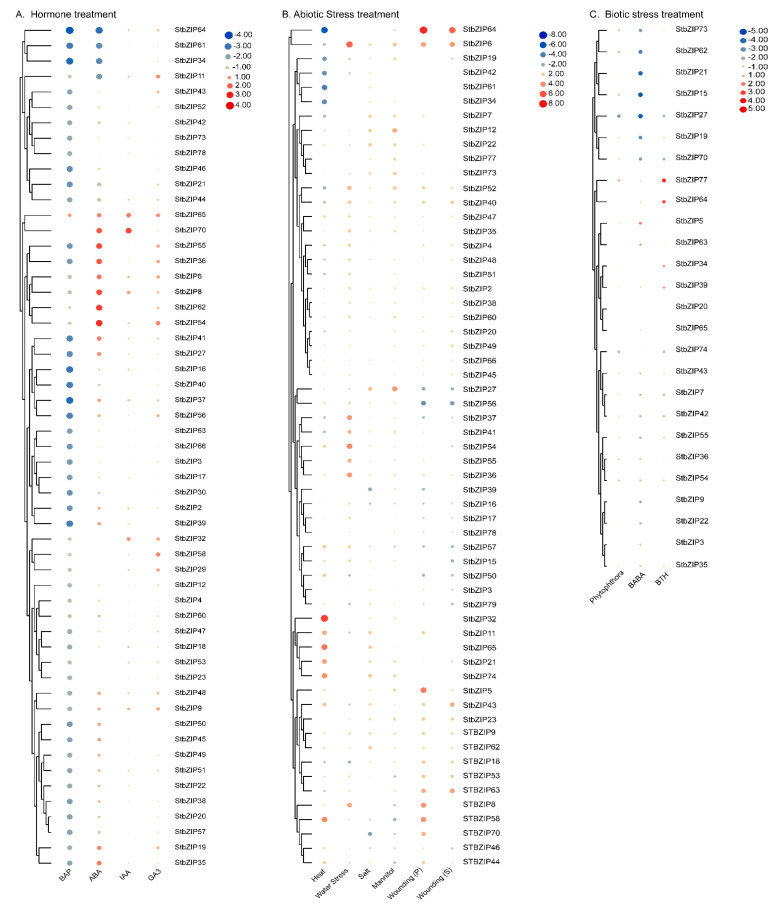
Figure 8.
Heat map and hierarchical clustering of StbZIP transcript levels in response to the hormone, abiotic stress, and biotic stress. The independent gene expression datasets are detailed in Supplementary Table S3. The relative changes in bZIP gene expression levels were obtained following treatment with: (A) benzyl amino purine (BAP), abscisic acid (ABA), indole-3-acetic acid (IAA), or gibberellic acid (GA3); (B) heat, water stress, salt, mannitol, and wounding; (C) P. infestans, D,L-β-aminobutyric acid (BABA) or Benzo[1–3]thiadiazole-7-carbothionic acid (BTH). The log2 fold change values map to a color gradient from low (blue) to high (red) expression.

