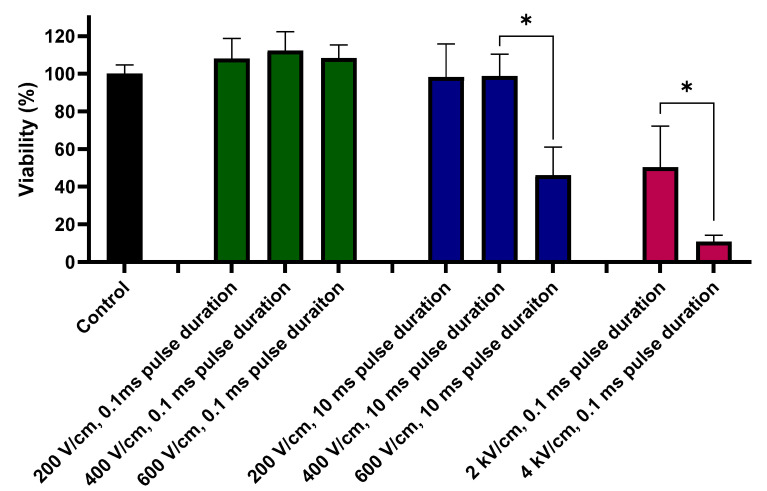
Figure 3.
Viability (%) of the cells after standard IRE protocol (2 and 4 kV/cm, 0.1 ms pulse duration, 8 pulses), 200–600 V/cm, 0.1 ms pulse duration, 8 pulses PEFs and PEFs with the elongated pulse duration (200–600 V/cm, 10 ms pulse duration, 8 pulses). Green bars represent 200–600 V/cm, 0.1 ms pulses; blue bars represent 200–600 V/cm, 10 ms pulses; red bars represent 2–4 kV/cm, 0.1 ms pulses. Data presented as average ± SD. One-way ANOVA test analysis: * p < 0.0001.

