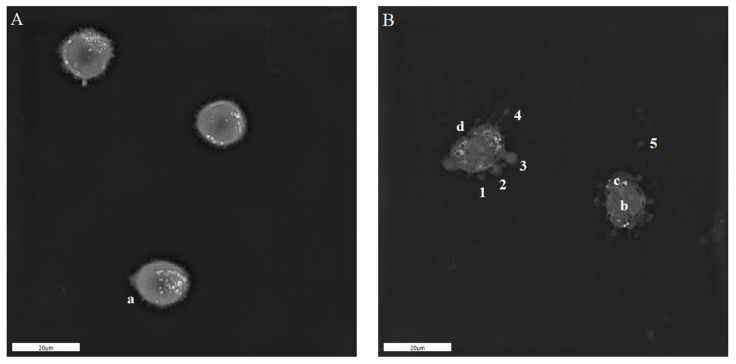
Figure 5.
Holotomographic microscopy studies of A375 cells after 4 kV/cm, 8 pulses, 0.1 ms pulse duration treatment. Photograph on the left side shows the normal morphology and filopodia of the cells suspended in the EP buffer (A). Photograph on the right side of the figure (B) presents blebbing cells after 4 kV/cm, 0.1 ms PEF treatment. 1, 2, 3—evolution of the blebs, 4—bleb release from the membrane, 5—free bleb outside the cell; a—filopodia, b—nucleus, c—cytoplasm, d—membrane invagination; scale bar—20 μm.

