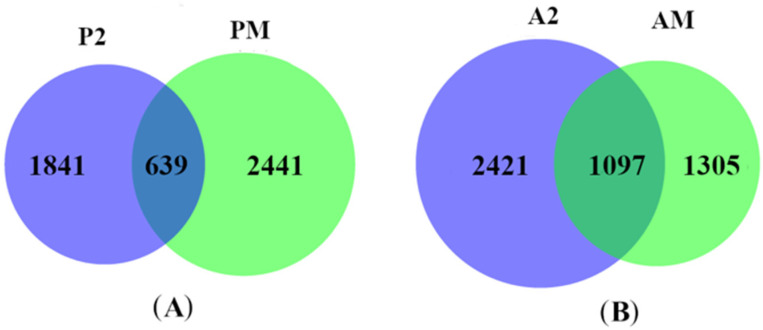
Figure 4.
Identification of DEGs during fruit cracking in pericarp and aril. The DEGs in the blue part has a significant correlation coefficient (p < 0.05) with DCR, and the DEGs in the green part are genes that showed differential expression in pericarp (A) and aril (B) between ‘Nuomici’ and ‘Huaizhi’ during fruit cracking.

