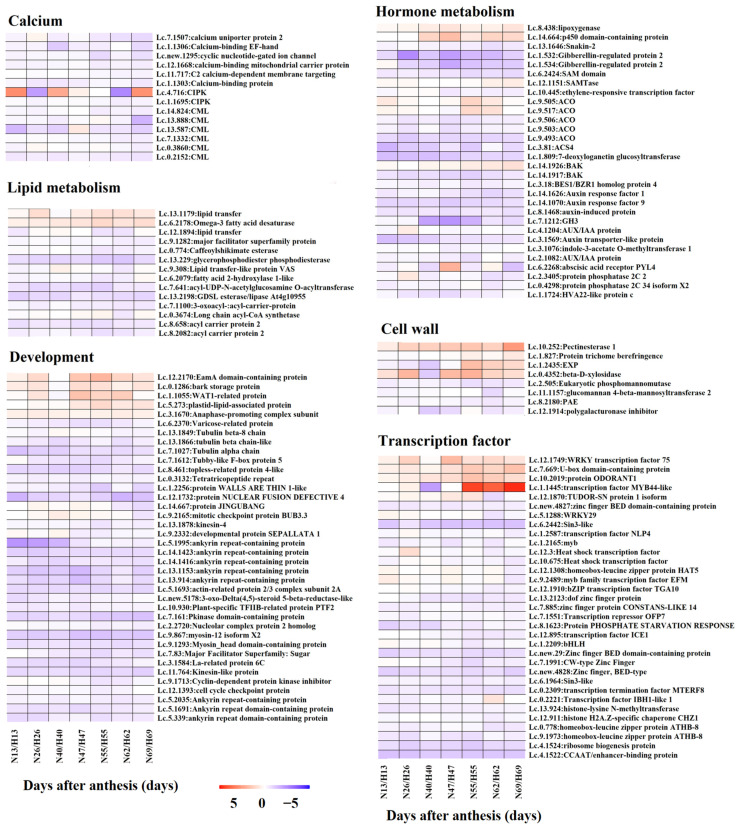
Figure 7.
Heatmaps of DEGs in pericarp involved in specific pathways. Heatmaps showing the DEGs that are involved in calcium, lipid metabolism, development, hormone metabolism, cell wall, and transcription factors in pericarp. The ‘N’ and ‘H’ represent ‘Nuomici’ and ‘Huaizhi’, respectively. The numbers together with ‘N’ and ‘H’ indicate the days after anthesis. Fold changes in the ‘Nuomic’ relative to ‘Huaizhi’ after log2 conversion (FPKM values were converted to FPKM+1) are shown in a red-purple color scale: red, upregulated; purple, downregulated; white, unchanged.

