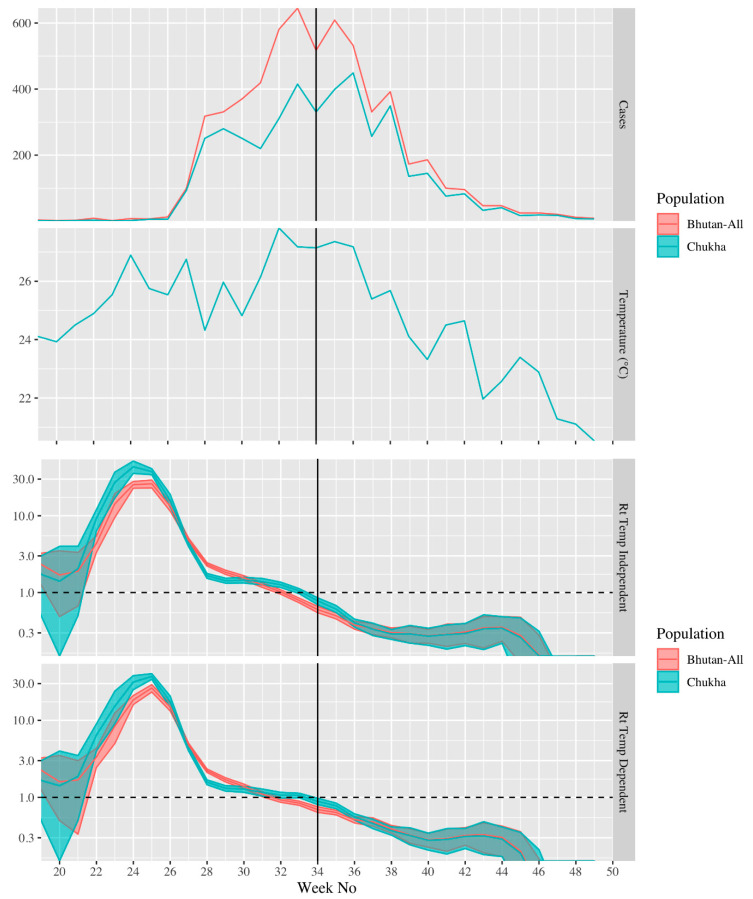
Figure 4.
From top to bottom: the number of dengue cases reported in National Early Warning, Alert, Response and Surveillance (NEWARS) each week in all of Bhutan and Chukha only; the weekly average temperature (°C) in Chukha; the effective reproduction number for cases developing symptoms in each week, assuming constant temperature over the period; the effective reproduction number for cases developing symptoms in each week, accounting for changes in temperature over the epidemic. The solid vertical line indicates the start of interventions in week 34. The dashed horizontal line in the bottom two panels indicates the critical value of the effective reproduction number (1.0). In the bottom two panels, the shaded regions indicate 95% confidence intervals and the y-axis is on a log-scale for clarity.

