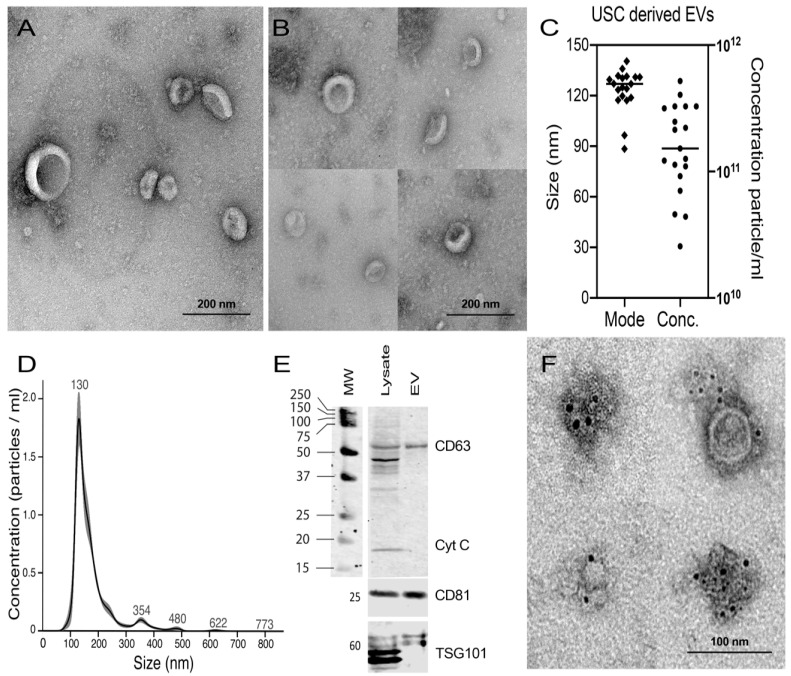
Figure 3.
Characterization of USCs–derived EVs; (A,B) TEM negative staining of the isolated EVs showing cup–shaped vesicles with an average size of 110 nm visualized at lower magnification (A; Mic. Mag. ×23,000) and higher magnification (B; Mic. Mag. ×30,000) (2%Uranyl Acetate). (C) Histogram presentation of 19 EVs pellets collected from 1.6 × 10⁷ USCs analyzed for size and concentration, showing an average size of 122 nm and an average concentration of 1.90925 × 10¹¹. (D) Size distribution curve of USCs isolated EVs particle concentration (×107) vs. particle size mode, measured by nanoparticle tracking analysis (NTA) showing the average of the six technical replicate measurements for each exosome isolation by NanosightS300. (E) Western blot of USCs cell lysate and isolated the EVs for CD63, CD81, TSG101 antibodies as positive markers for EVs and Cytochrome C as mitochondrial membrane marker (cellular Marker) and negative marker for EVs. (F) Immune gold staining of the isolated vesicles for CD63 using 6 nm gold nanoparticles (2% Uranyl Acetate, scale bar = 100nm, Mic. Mag. ×30,000 (upper left) and ×23,000 rest).

