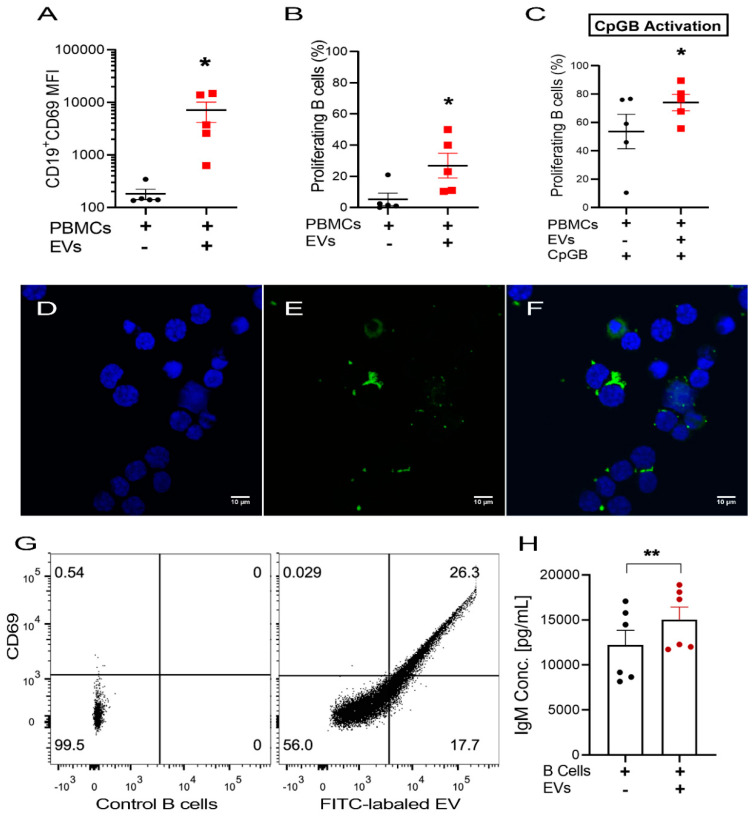
Figure 4.
The effect of USCs EVs on B cells; (A) CD69 (early activation marker) expression on B cells population showing increased expression with EV co-culture. (B,C) Proliferation assay of the % proliferating B cells as the result of EVs co-culture in (B) resting and (C) CpGB–stimulated conditions showing significant enhancement of proliferation in both conditions in response to EV co-culture (n = 5). (D–F) Confocal microscopy images of DAPI (4′,6-diamidino-2-phenylindole) stained purified B cells (D) co-cultured with labeled EVs (E) for 24 h, (F) showing the presence of labeled EVs inside the cytoplasm and in aggregates attached to the cell surface (Mic. Magnification ×600, scale bar = 10 µm). (G) A representative sample of flow cytometry analysis of CD69+ B cell population for FITC labeled EVs uptake versus control. (H) Antibody analysis of the supernatant showing a significant increase of IgM with EV co-culture (n = 6). Values are presented as Mean ± SEM, p-values were determined by Paired Student’s t–tests. * p < 0.05, ** p < 0.01.

