Figure 5.
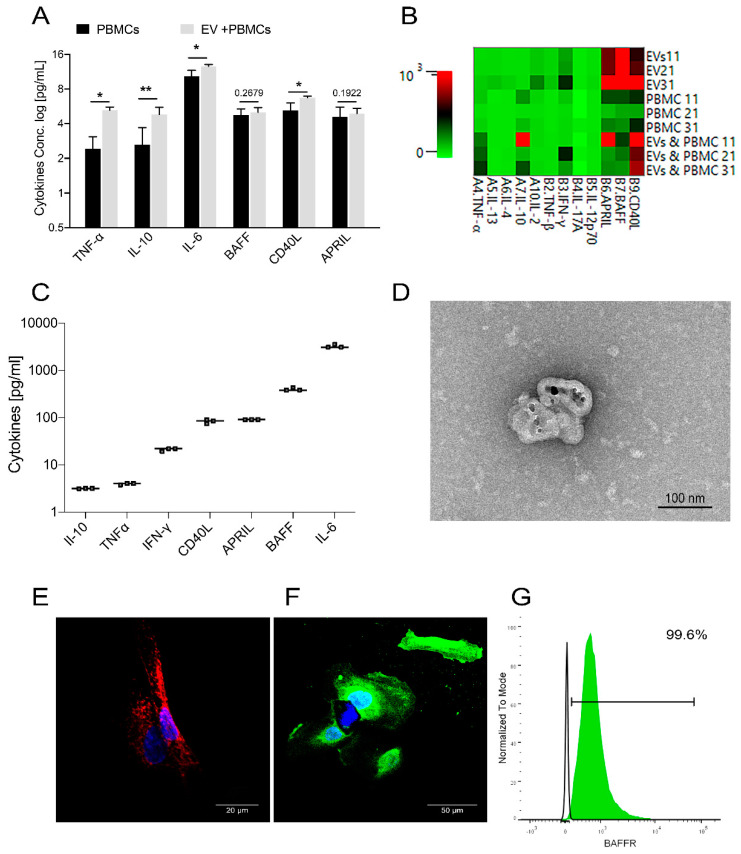
Cytokines Analysis of the EVs; (A) Cytokines analysis of EV co-culture supernatant run by Biolegend plex assay shows a significant increase in IL6, CD40L, IL10, and TNFα in response to EV co-culture (n = 3). (B) Heat map of the EV lysates, PBMCs, and the co-culture for cytokines concentration generated by Bio–legendplex software. (C) Cytokines analysis of 10 µg/mL EV lysates shows the expression of considerable amounts of IL–6, BAFF, APRIL, CD40L, and traces of IL–10, TNFα, and IFN–γ (n = 3). (D) Immune gold staining of the isolated vesicles for CD40L using 6 nm gold nanoparticles (Mic. Mag. ×23,000, 2% Uranyl Acetate). (E) Confocal microscope image of DAPI (blue) stained USC after permeabilization for CD40L mAb (red) (Mic. Mag. ×600, scale bar = 20 µm). (F) Confocal microscope image of DAPI (blue) stained USCs after staining with BAFFR mAb (green) (Mic. Mag. ×600, scale bar = 50 µm). (G) Flow cytometry analysis of 104 USCs for BAFFR expression showing 99% positive cells (green shaded histogram) in relation to the isotype control (non–shaded histogram), representative sample. Values are presented as mean ± SEM and p–values were determined by paired Student’s t–tests. Cytokines data are prior to log treatment. * p < 0.05, ** p < 0.01.

