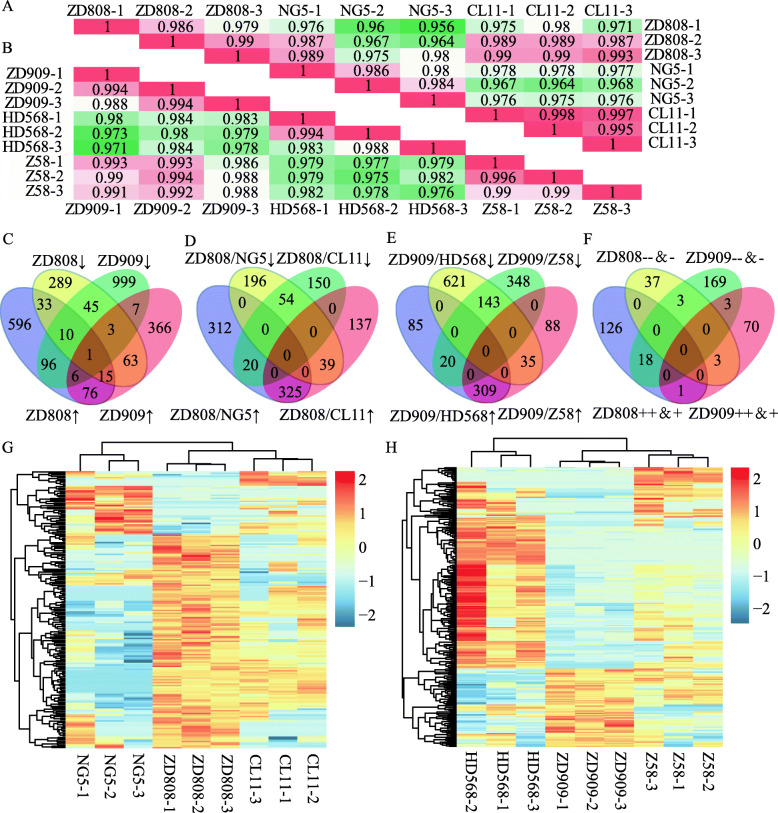
Fig. 2.
Statistical analysis of three biological repeats of two hybrids and their parental lines. (A) Pearson’s correlation analysis of maize hybrid Zhongdan 808 and its female parent CL11 and male parent NG5. (B) Pearson’s correlation analysis of maize hybrid Zhongdan 909 and its female parent Z58 and male parent HD568. (C) Venn diagram of up-regulated and down-regulated DAPs in hybrids compared independently with the female and male parents. (D) Venn diagram of up-regulated and down-regulated DAPs in Zhongdan 808 when compared with its female parent CL11 and male parent NG5. (E) Venn diagram of up-regulated and down-regulated DAPs in Zhongdan 909 when compared with its female parent Z58 and male parent HD568. (F) NAPs in Zhongdan 808 and Zhongdan 909. (G) Heatmaps for cluster analysis of all the non-additive proteins in Zhongdan 808 and its parents. (H) Heatmaps for cluster analysis of all the non-additive proteins in Zhongdan 909 and its parents. ‘ZD808’ indicates Zhongdan 808, ‘ZD909’ indicates Zhongdan 909, ‘↑’ indicates a protein up-regulated in hybrids by at least a 2-fold change compared with any parent, ‘↓’ indicates a protein down-regulated in hybrids by at least a 2-fold change compared with one parent, ‘+’ indicates high parent abundance NAPs, ‘++’ indicates above-high parent abundance NAPs, ‘−’ indicates low parent abundance NAPs, ‘− −’ indicates below-low parent abundance NAPs. The selection criterion for DAPs was fold change > 2, and the criteria for NAPs was fold change > 1.5 and p < 0.05

