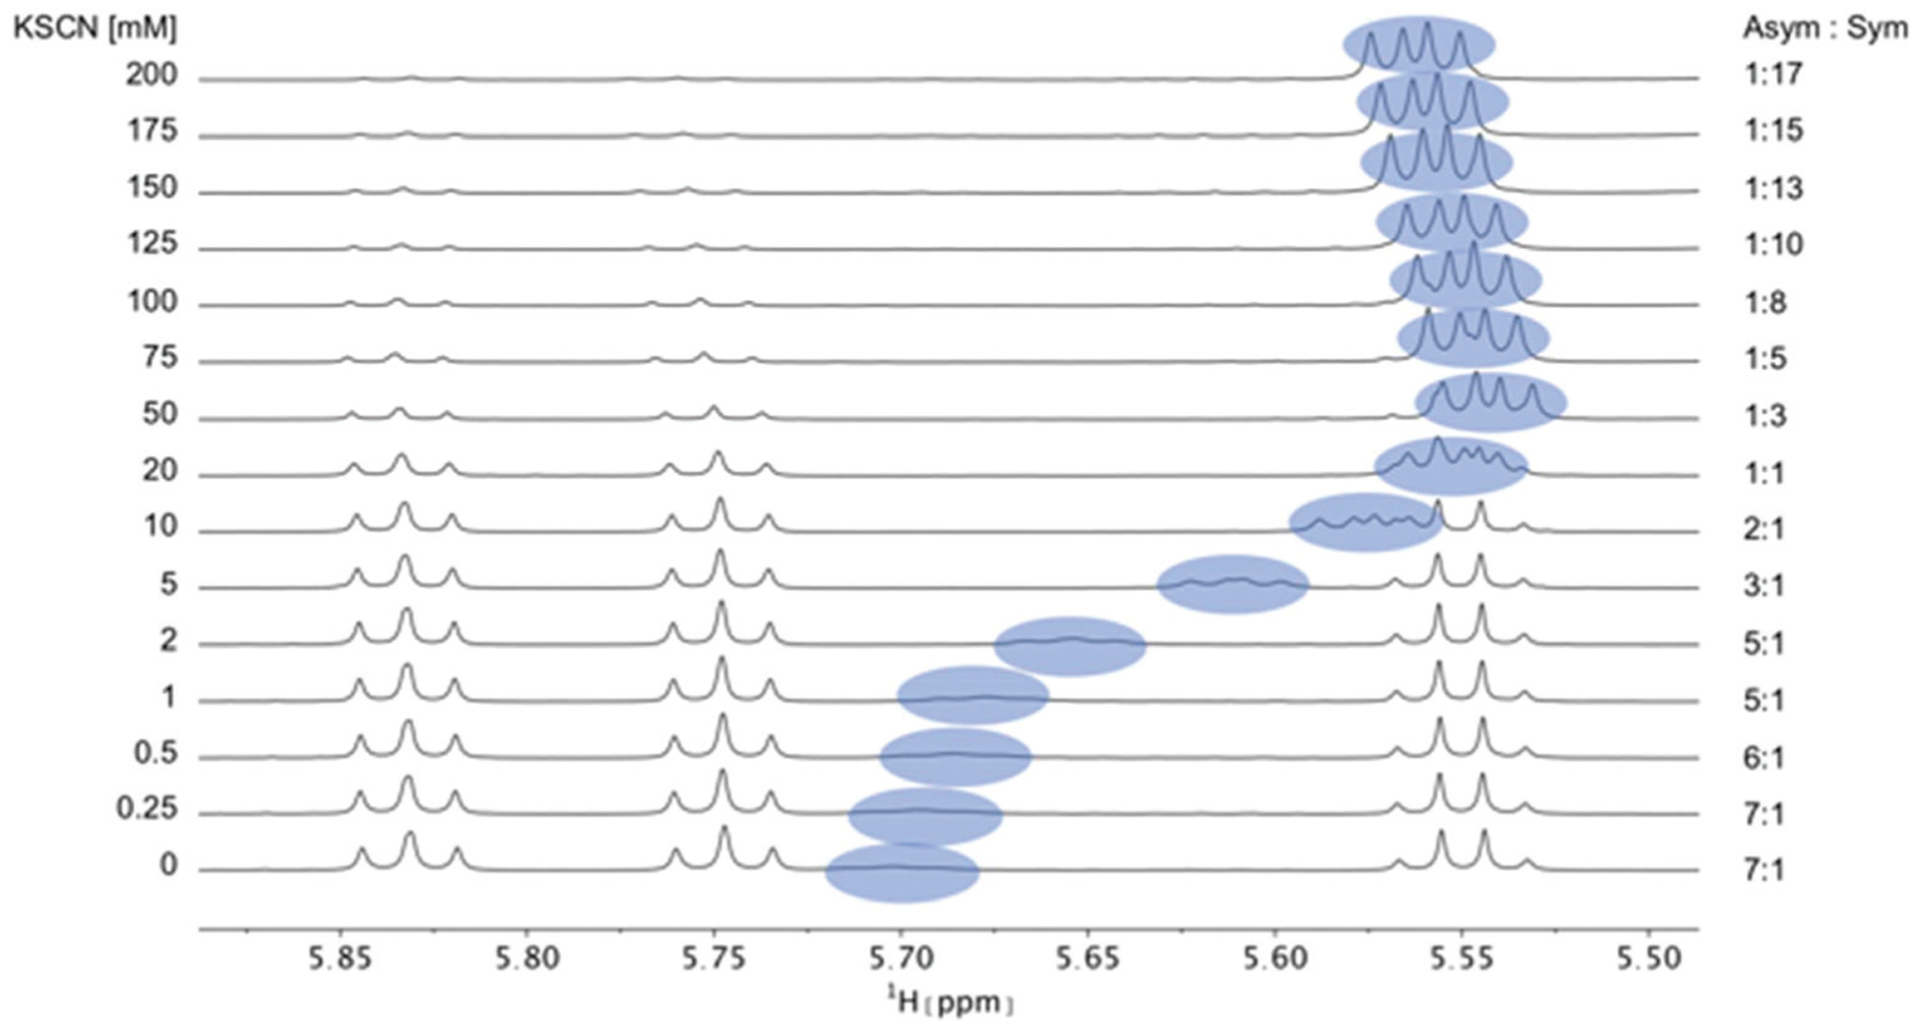
Fig. 4.

Titration of 5 mM PF1022A (1) with a KSCN solution in CD3OH: Hα region of 1H NMR spectra. Chemical shift changes were observed for the symmetric conformation, best seen for the signal of the Hα proton in residue Phl37 (blue labels). In addition, a change in the ratio between the symmetric and asymmetric conformation is observed. Also the asymmetric conformation shows small changes in chemical shift at high salt concentrations. The titration plot for emodepside (2) can be found in the ESI.†
