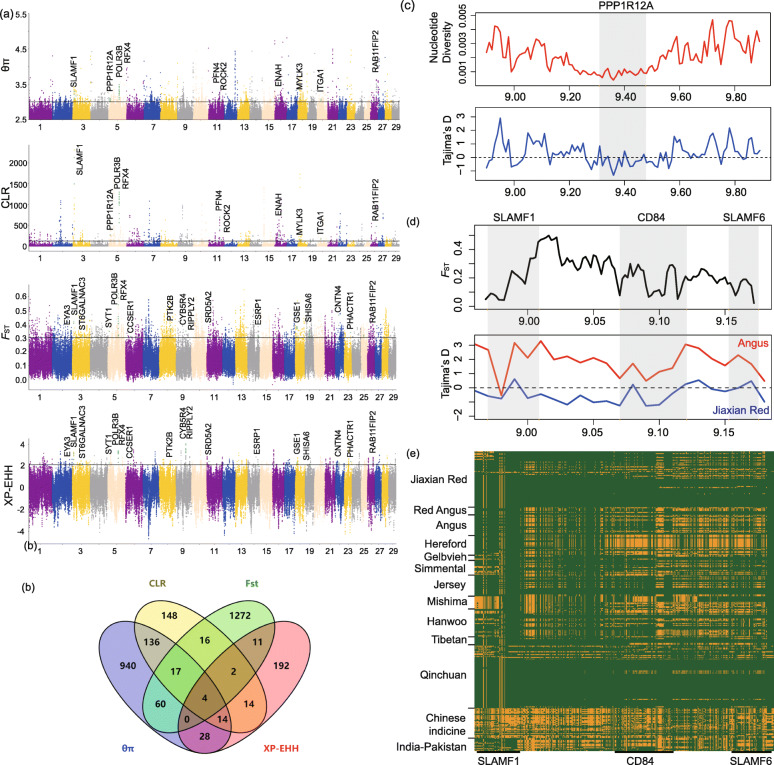
Fig. 3.
Analysis of the signatures of positive selection in the genome of Jiaxian Red. a Manhattan plot of selective sweeps in Jiaxian Red. b Venn diagram showing the genes overlap among θπ, CLR, FST and XP-EHH. c Nucleotide diversity and Tajima’s D at the PPP1R12A gene region. d FST and Tajima’s D plots of the SLAMF1, CD84 and SLAMF6 genomic regions. e SNPs with minor allele frequencies > 0.05 are used to construct haplotype patterns (Chr 3: 8.97–9.18 Mb). The major allele at each SNP position in Jiaxian Red is colored in yellow, the minor one in green

