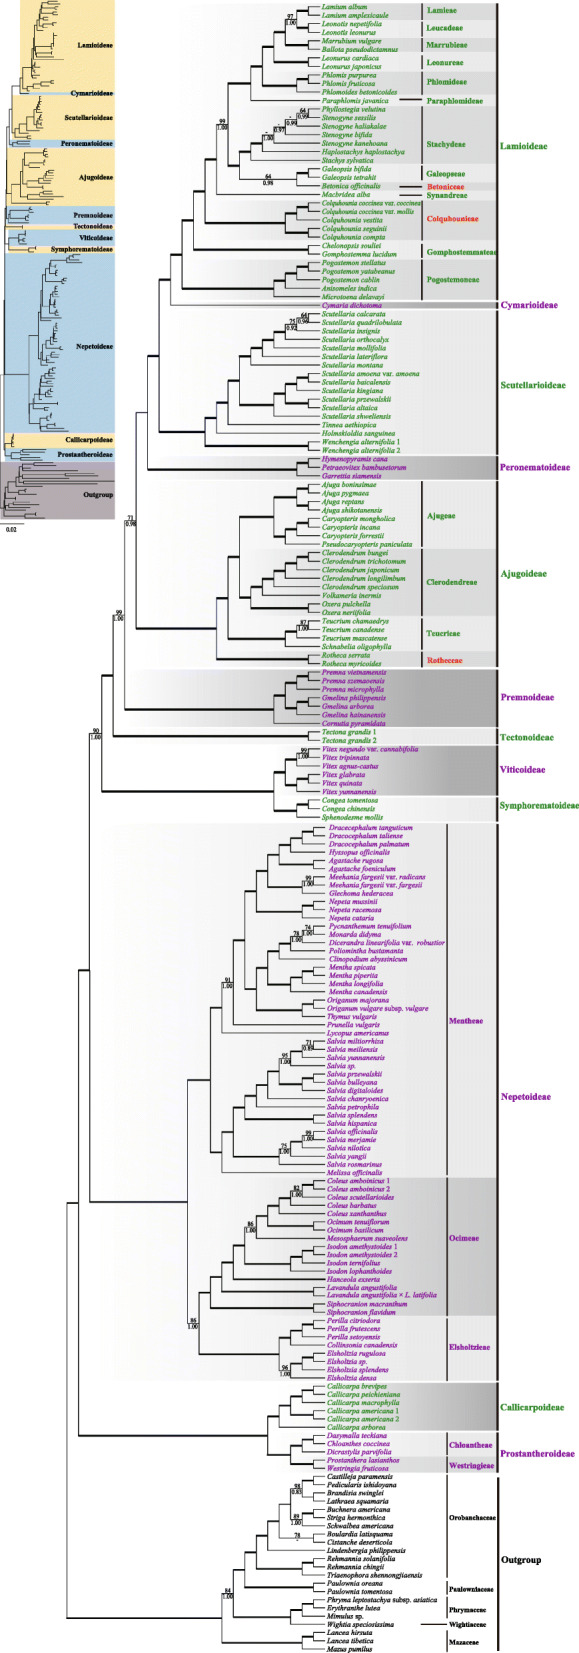
Fig. 1.

Maximum likelihood phylogeny of Lamiaceae based on combined 79 plastid coding regions dataset, with ambiguously aligned sites excluded. Maximum likelihood bootstrap support (MLBS) and Bayesian inference posterior probability (BIPP) are shown above and below the branches, respectively. Bold horizontal lines indicate clades with BIPP = 1.00) and MLBS = 100%. A “–” indicates MLBS values < 50% and BIPP < 0.8. Subfamilies and tribes recognized by Li et al. [19] and Li and Olmstead [51] are indicated by gray boxes, while new tribes proposed in this study were marked in red font
