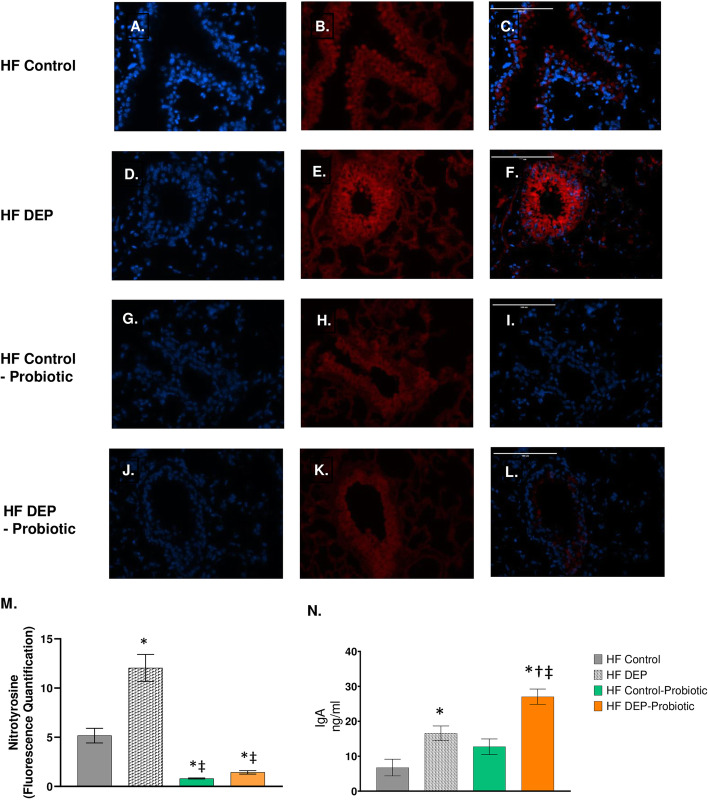
Fig. 14.
Probiotic supplementation decreases nitrotyrosine expression and enhances IgA production. Representative images of nitrotyrosine expression in the lungs of C57Bl/6 mice, on a high-fat (HF) diet exposed to either (a–c) saline, (d–f) DEP – 35 μg PM, or (g–i) saline and probiotics - 0.3 g/day (~ 7.5 × 10⁷ cfu/day) and (j-l) DEP and probiotics. Red fluorescence indicates nitrotyrosine expression, blue fluorescence is nuclear staining (Hoechst). Right panels (c, f, i, l) are merged figures of left (blue; a, d, g, j) and center (red; b, e, h, k) panels. m Graph of histology analysis of lung nitrotyrosine fluorescence. n Quantification of IgA (ng/ml) in the bronchoalveolar lavage fluid by ELISA. Data are depicted as mean ± SEM with *p < 0.05 compared to HF Control, †p < 0.05 compared to HF Control - Probiotics, ‡p < 0.05 compared to HF DEP by two way ANOVA

