Fig. 8.
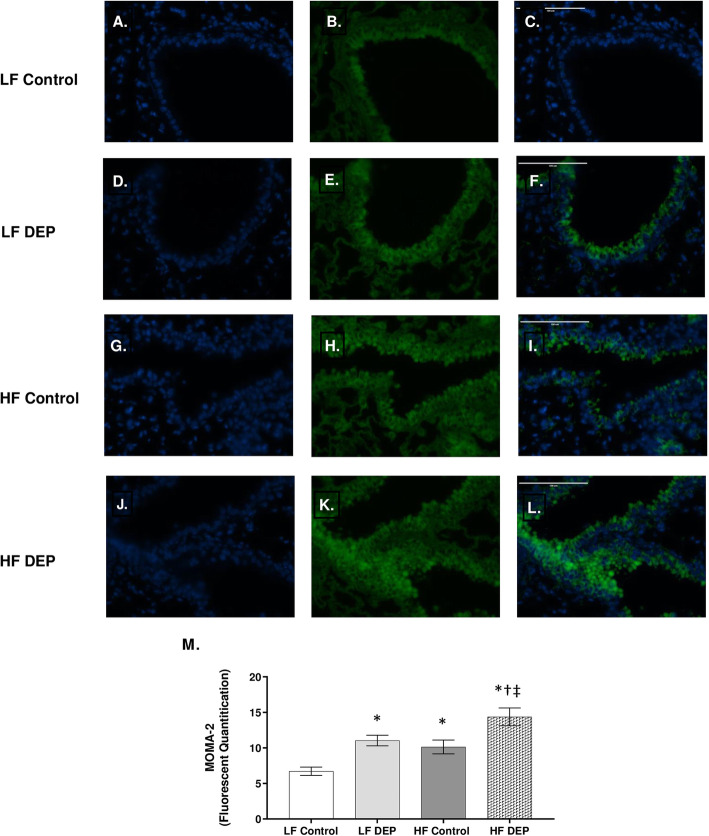
Mice exposed to diesel exhaust particles express higher levels of MOMA-2. Representative images of MOMA-2 expression in the lungs of C57Bl/6 mice on a control (LF; a-c) or high-fat (HF; g-i) diet exposed to saline (control) or on a LF (d-f) or HF diet (j-l) exposed to diesel exhaust particles (DEP – 35 μg PM) twice a week for a total of 30 days. Green fluorescence indicates MOMA-2 expression, blue fluorescence is nuclear staining (Hoechst). Right panels (c, f, i, l) are merged figures of left (blue; a, d, g, j) and center (green; b, e, h, k) panels. m Graph of histology analysis of lung MOMA-2 fluorescence. 40x magnification; scale bar = 100 μm. Data are depicted as mean ± SEM with *p < 0.05 compared to LF Control, †p < 0.05 compared to HF Control, ‡p < 0.05 compared to LF DEP by two way ANOVA

