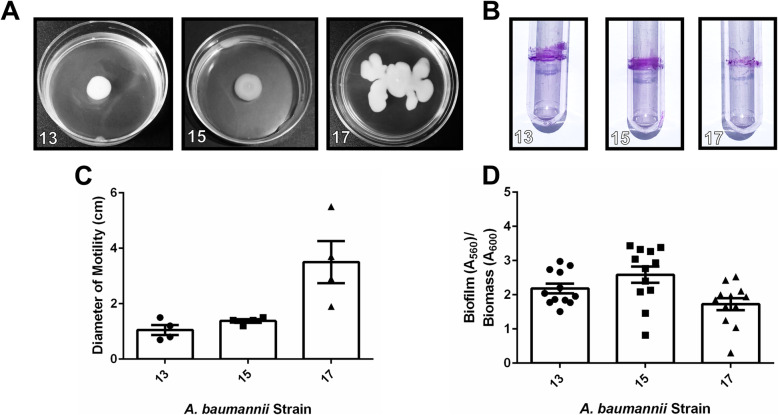
Fig. 2.
Analysis of motility and biofilm phenotypes from A. baumannii strains isolated from blood samples. a Motility agar plates 24 h post-inoculation with A. baumannii clinical isolate strains. b Crystal violet stained A. baumannii biofilms in polystyrene tubes. c Quantitative analysis of bacterial motility as determined by measurement of diameter of bacterial cells present on the plate. Bars indicate mean values (+/− standard error mean error bars) with individual biological replicates indicated by discrete points (n=4). d Quantitative analysis of ratio of biofilm to biomass. Biofilm was determined by solubilization of crystal violet and spectrophotometric measurement at OD560. Biomass was determined by spectrophotometric measurement at OD600. Bars indicate mean values (+/− standard error mean error bars) with individual data points indicated by discrete points (n=3 biological replicates with 3–4 technical replicates per experiment)

