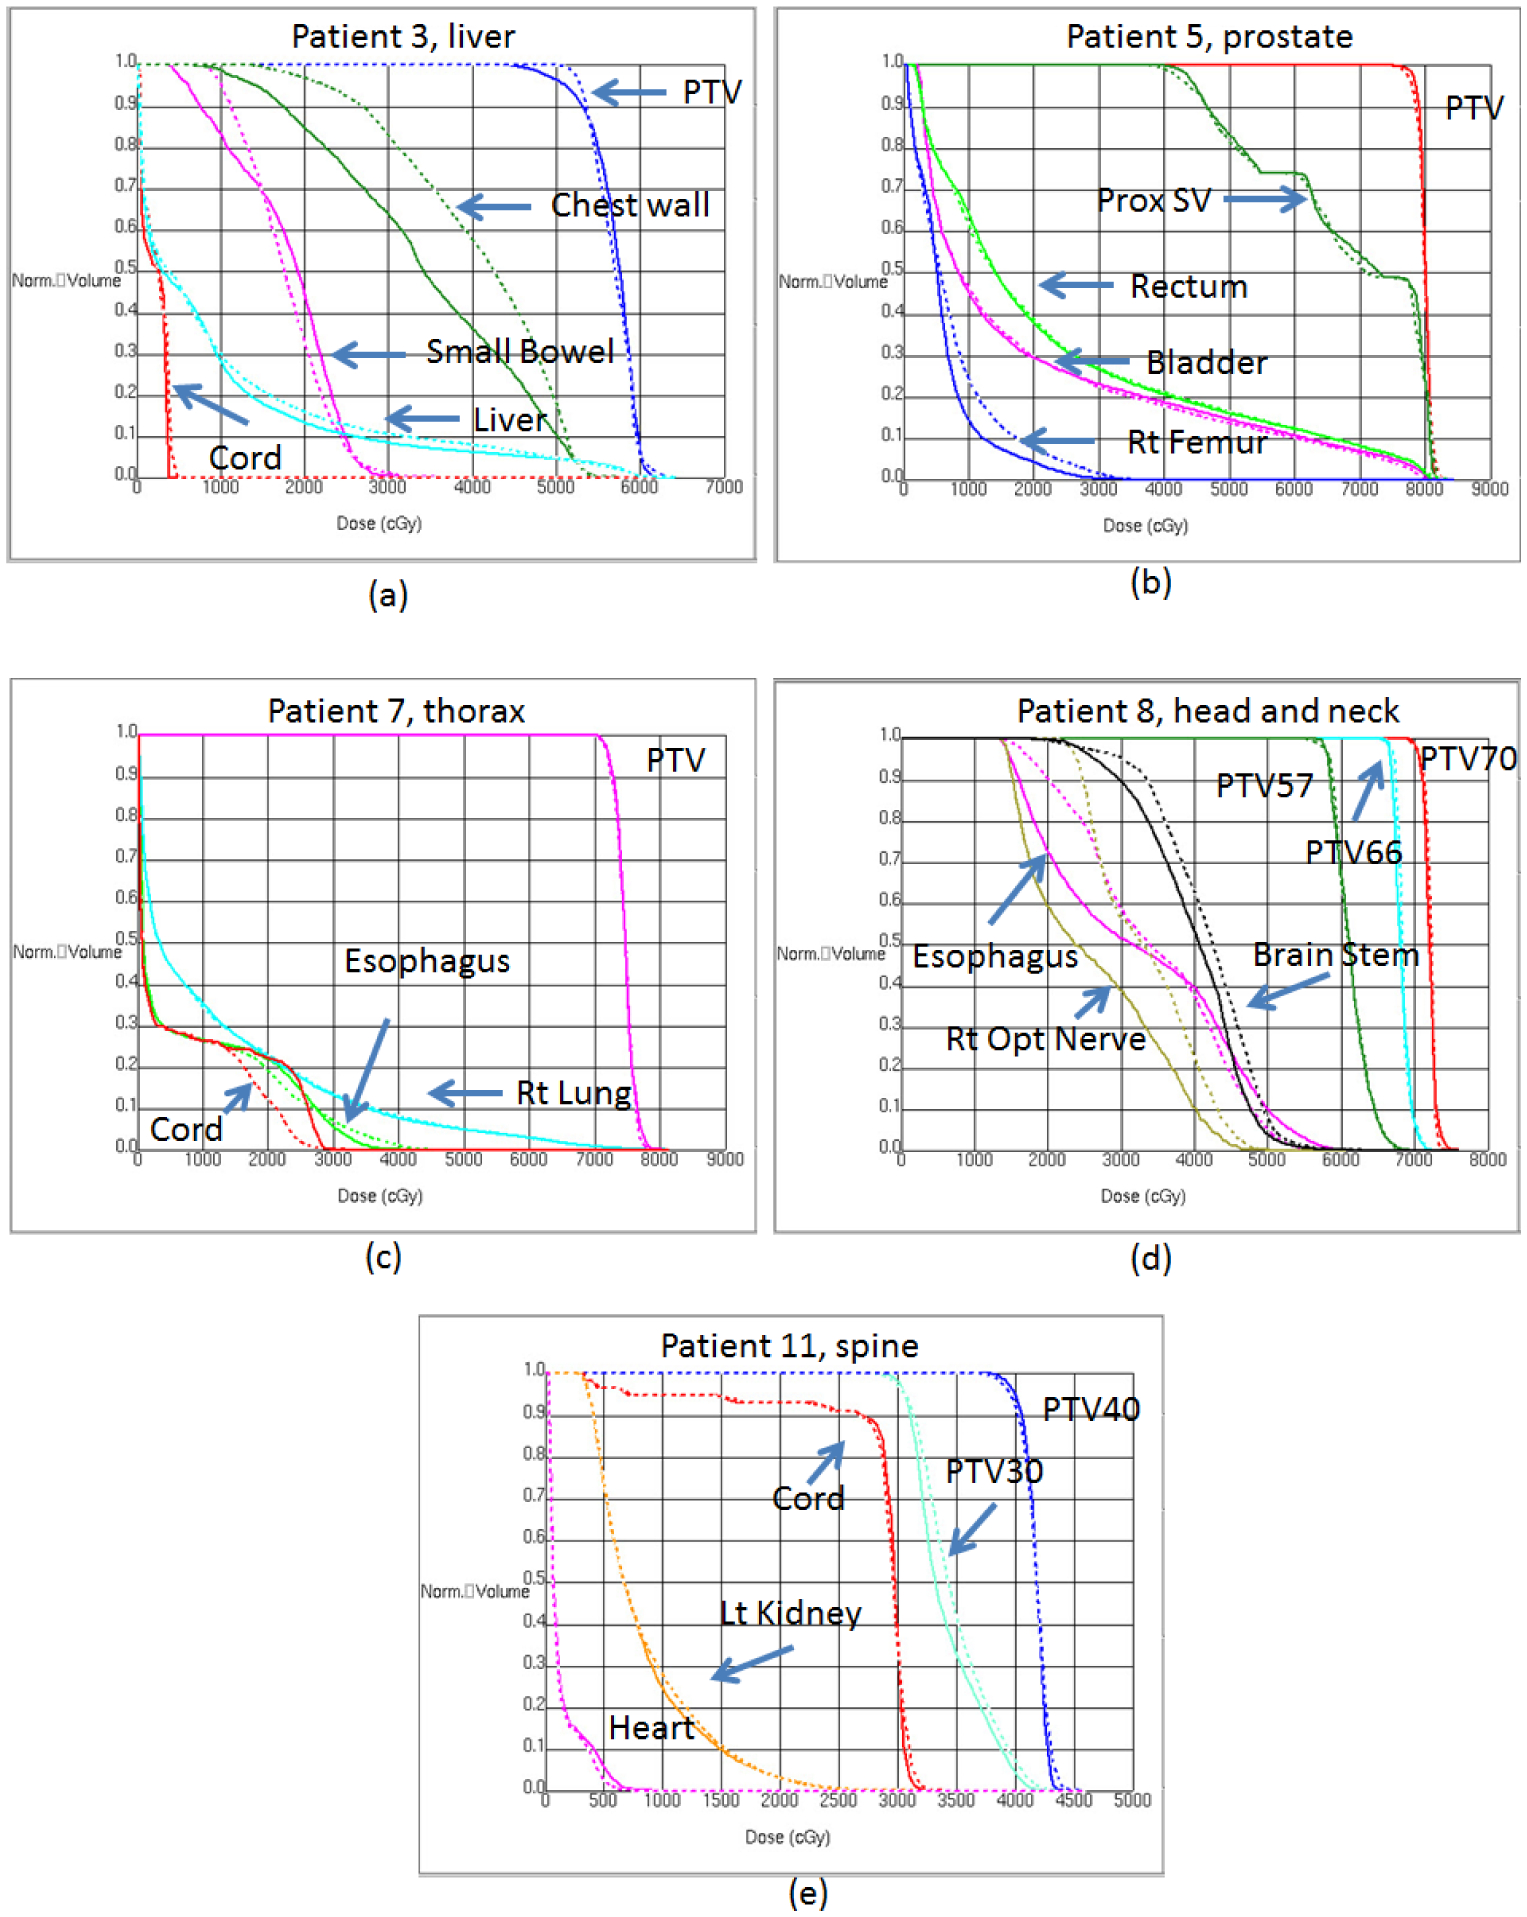
Figure 4.

Dose-volume histogram data for patients with a liver tumor (patient 3; (a)), a prostate tumor (patient 5; (b)), a lung tumor (patient 7; (c)), a nasopharyngeal tumor (patient 8; (d)), and a T9–T10 spinal tumor (patient 11; (e)). Solid lines are values from the control plans; dashed lines are values from the distorted plans. Abbreviations: PTV, planning target volume; Prox SV, proximal seminal vesicle; Rt, right; Lt, left.
