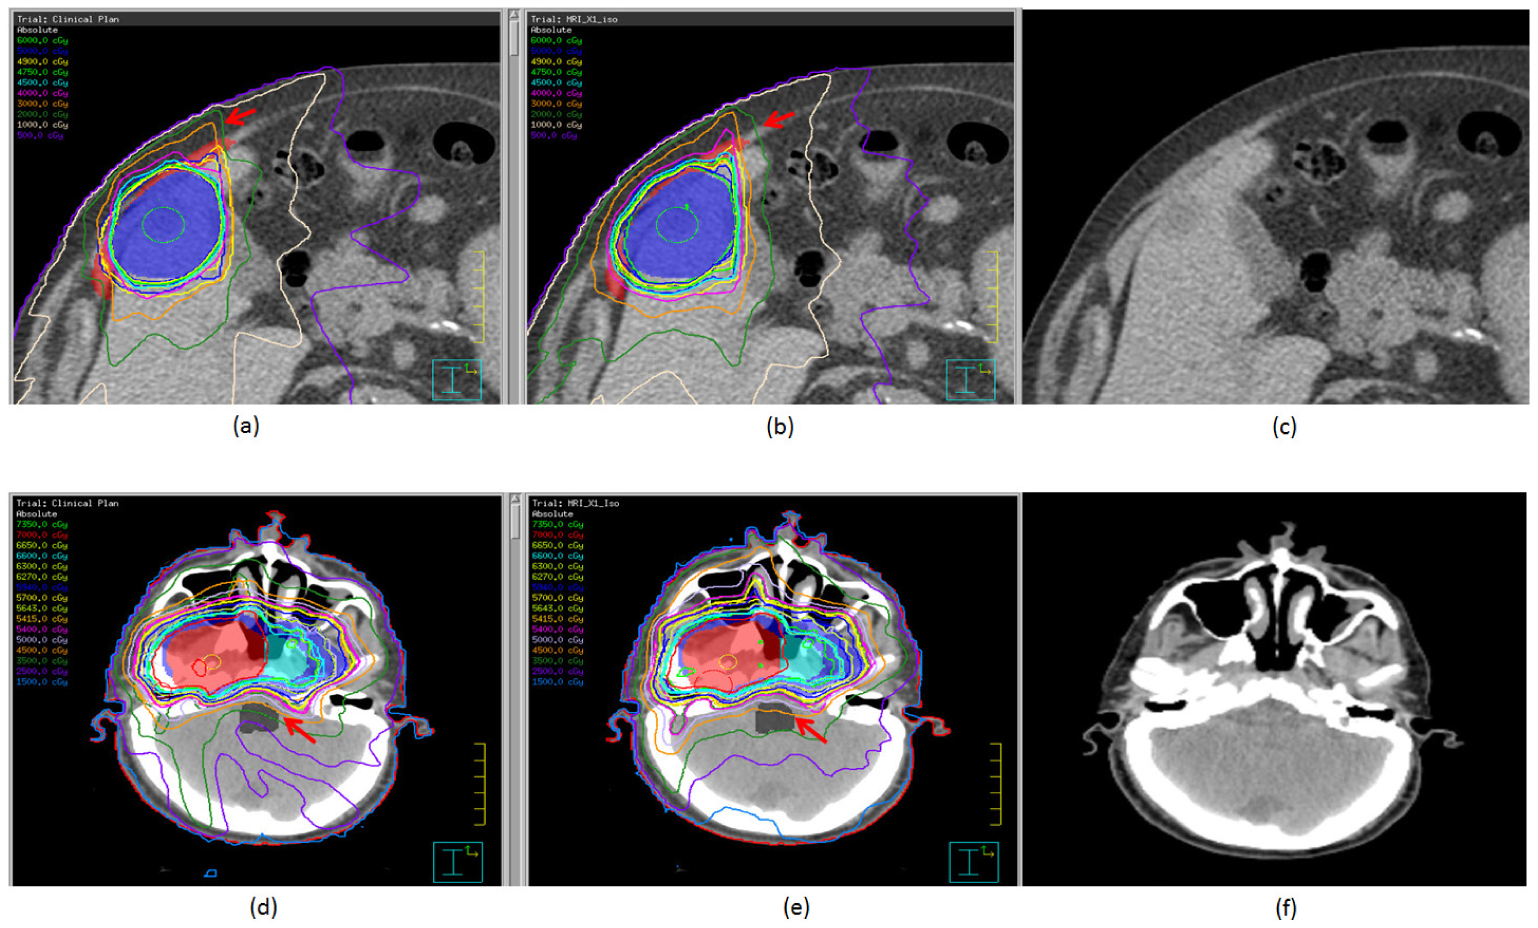
Figure 5.

Treatment plans, with isodose distributions, for a patient with a liver tumor (patient 3; (a)–(c)) and a patient with a nasopharyngeal tumor (patient 8; (d)–(f)). Panels (a) and (d) are the control plans, panels (b) and (e) are the distorted plans, and panels (c) and (f) are the distorted CT images. For patient 3, the target (blue) and the chest wall (red) are shown in color wash. For patient 8, targets are shown in color wash. The red arrows point to differences between the control plans and the distorted plans.
