Fig. 2.
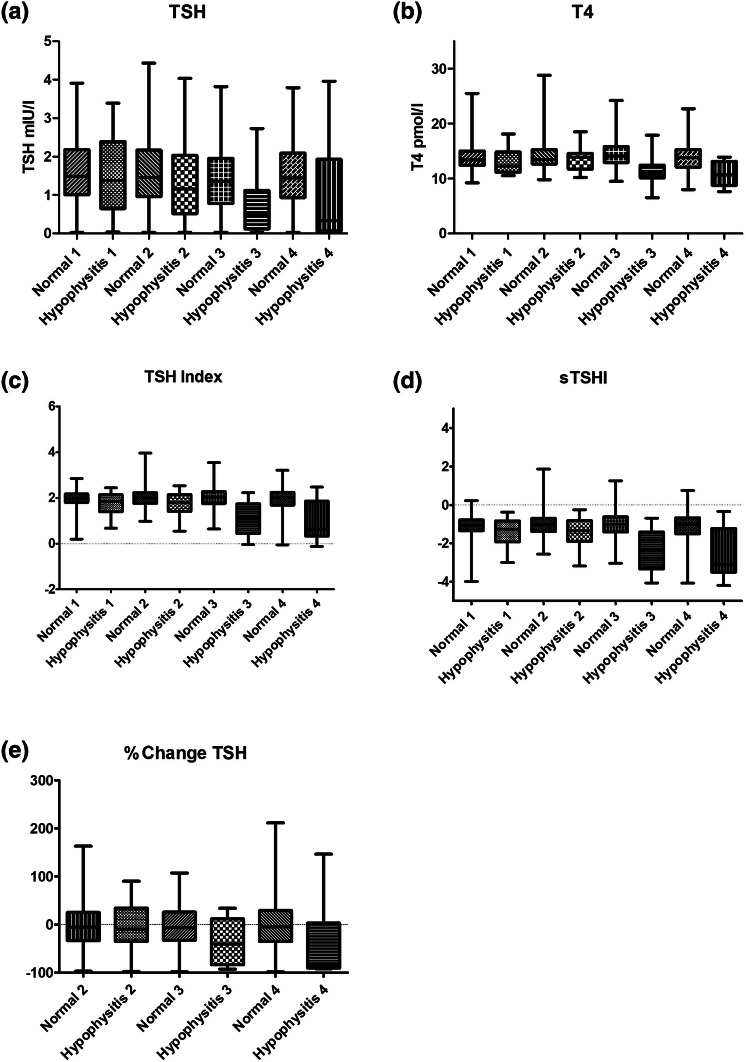
Change in thyroid function over 4 cycles of treatment with ipilimumab in those diagnosed with hypophysitis (left hand columns) and normal controls without hypophysitis (right hand columns). a TSH b Free T4 c TSH index d standardised TSH index and e % change in TSH from baseline (pre-cycle 1). All graphs show whisker plots with vertical bars indicating minimum and maximum values. Number if included patients at each cycle: Hypophysits Cycle 1 = 24, Cycle 2 = 19, Cycle 3 = 17 and Cycle 4 = 10; Controls Cycle 1 = 217, Cycle 2 = 168, Cycle 3 = 117, Cycle 4 = 86

