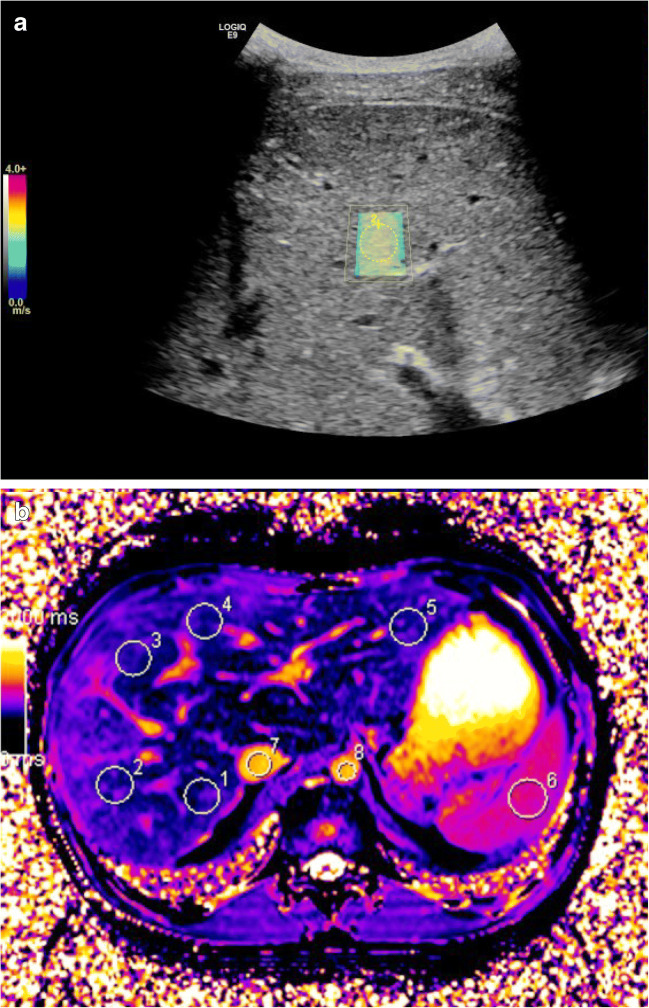
Fig. 2.
Images of shear-wave elastography and native MR T1 mapping in a 15-year old girl with Fontan circulation. a Shear-wave elastography. The colors in the region of interest (yellow circle) indicate an increased value of 1.9 m/s. b Native MR T1 map shows an uneven color distribution. White circles indicate five regions of interest within the liver (1–5), one in the spleen (6), one in the inferior caval vein (7) and one in the aorta (8)

