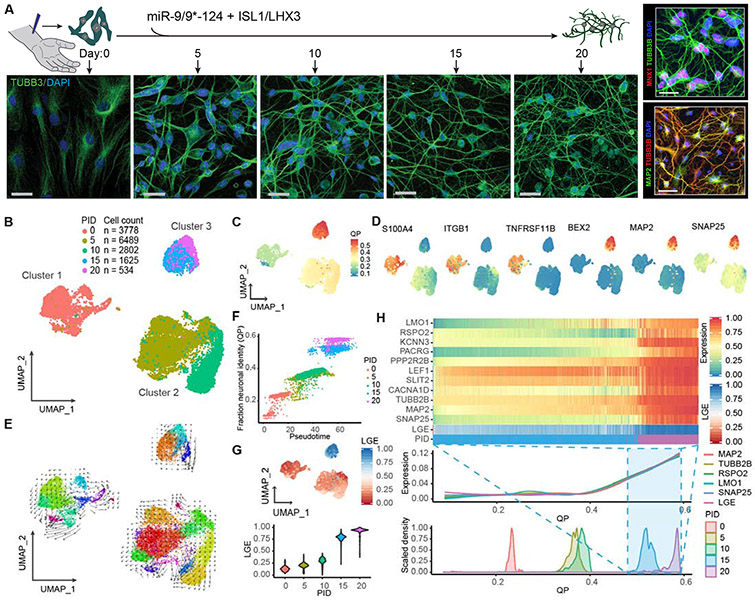
Figure 1. Distinct reprogramming states of human fibroblasts to neurons by miR-9/9*-124 and ISL1/LHX3.
(A) Experimental scheme for studying cellular dynamics of neuronal reprogramming by miR-9/9*-124 and ISL1/LHX3. Human adult fibroblasts (HAFs) undergoing neuronal reprogramming were immunostained with TUBB3 to show morphological changes from day 0, 5, 10, 15, and 20. Scale bars, 20 μm. Right panel, top: Moto-miNs immunostained with motor neuron marker MNX1 and morphology marker TUBB3 at day 22. Scale bar, 23 μm. Right panel, bottom: Moto-miNs immunostained with neuronal marker MAP2 and TUBB3 at day 30. Scale bar, 45 μm. (B) UMAP projection of cells colored by time points (PID = post-induction day for microRNAs). (C) UMAP projection of cells colored by quadratic programing (QP) score. (D) UMAP projection of cells colored by expression of fibroblast-enriched genes (S100A4, ITGB1, TNFRSF11B) and neuronal genes (MAP2, BEX2, SNAP25). (E) RNA velocity analysis applied to the UMAP projection of cells, colored by sub-clusters. (F) Biplot showing the correlation between cell orders based on principle curve analysis (pseudotime) and fraction neuronal identity (QP). Cells are colored by time points. Pearson correlation coefficient = 0.94. (G) UMAP projection of cells colored by the median expression for the top 5% longest genes (LGE = long gene expression), and LGE violin plot of cells grouped by time point during reprogramming. (H) Heatmap showing expression (scaled 0-1 for each gene) of mature motor neuron markers and LGE scores (scaled 0-1) between PID 15 and 20. Cells are ordered from left to right by increasing QP scores. Aligned below are two plots also organized left to right by increasing QP scores: a Loess regression of neuronal gene expression, including total LGE, and a scaled density plot of QP scores grouped by time points.

