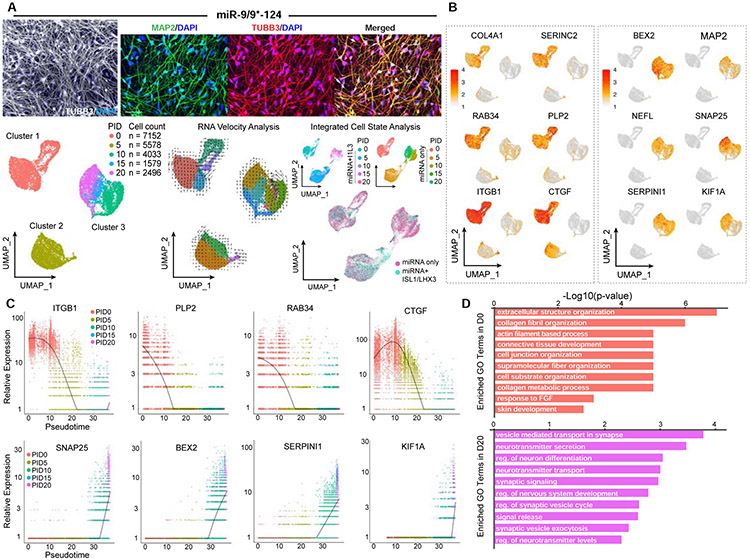
Figure 2. miR-9/9*-124 alone are sufficient to induce homogenous fibroblast identity erasure and neuronal fate activation.
(A) Examples of conversion of HAFs cells with miR-9/9*-124-only. Left: A representative picture showing the morphologies of converted cells immunostained for TUBB3 (in gray). Scale bar, 20 μm. Top: Zoomed in pictures of converted cells stained for TUBB3 (left), MAP2 (middle), and merged (right). Scale bar, 50 μm. Bottom, left: Visualization of scRNA-seq data. UMAP projection of cells colored by time points. Bottom, center: RNA velocity analysis applied to the UMAP projection colored by sub-clusters. Bottom, right: Integrated cell state analysis plots of full time-course miN cell populations onto the full time-course moto-miN UMAP. (B) UMAP projection of cells colored by expression of fibroblast-enriched genes (COL4A1, SERINC2, RAB34, PLP2, ITGB1, CTGF) and neuronal genes (BEX2, MAP2, NEFL, SNAP25, SERPINI1, KIF1A). (C) Scatter plots showing the correlation between cell orders based on Monocle (pseudotime) and relative gene expression analyses. Cells are colored by time points. Top: Expression of fibroblast-enriched gene examples (ITGB1, PLP2, RAB34, CTGF) over pseudotime. Bottom: Expression of neuronal gene examples (SNAP25, BEX2, SERPINI1, KIF1A). D) Top Gene Ontology (GO) terms for biological processes of DEGs enriched in Day 0 compared to Day 20 (top, salmon) or Day 20 compared to Day 0 (bottom, purple).

