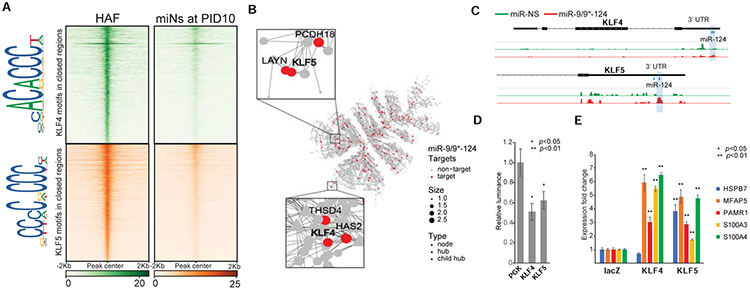
Figure 5. KLF4 and KLF5 are key miR-9/9*-124 targets in fibroblast.
(A) Heatmaps of KLF4 and KLF5 binding site density within chromatin loci that close between Days 0 and 10 of miR-9/9*-124 expression. Legend depicts representative motifs for KLF4 and KLF5 binding sites within closed loci. (B) The top fibroblast network targeted by miR-9, miR-9*, and miR-124 as identified by AGO-HITS-CLIP (red) contains KLF4 and KLF5 as hubs in the network. (C) Representative IGV snapshots showing peaks enriched with miR-9/9*-124 (red) over miR-NS (green) expression within the KLF4 and KLF5 3’ UTRs. (D) Luciferase assay validation of KLF4 and KLF5 3’UTRs as repressive targets of miR-9/9*-124 in comparison to PGK 3’UTR as a negative control. (E) qPCR quantification of fibroblast genes (HSPB7, MFAP5, PAMR1, S100A3, S100A4) with LacZ (control), microRNA-resistant-KLF4 or -KLF5 overexpression with miR-9/9*-124.

