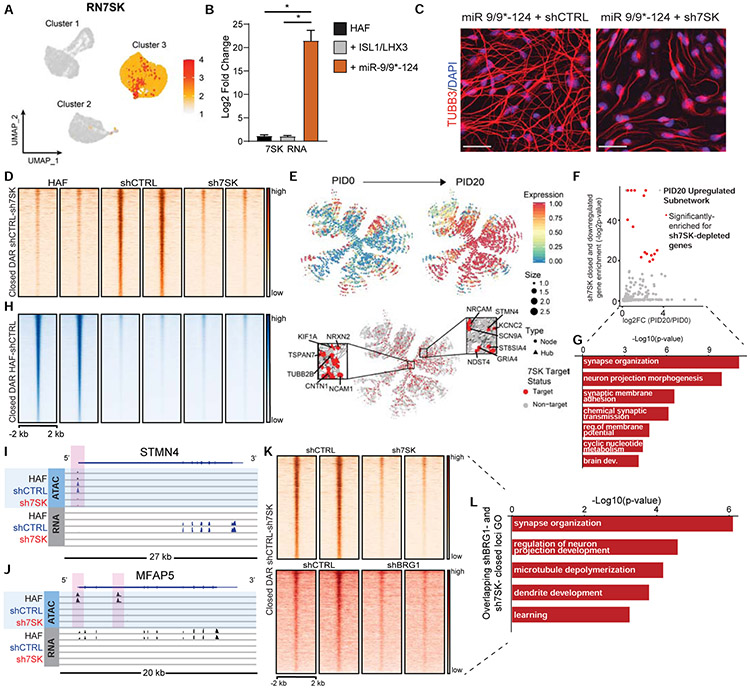
Figure 7. 7SK is a critical determinant of neuronal identity during reprogramming.
(A) UMAP projection of cells for RN7SK in the miR-9/9*-124-only scRNA-seq. (B) qPCR analysis of 7SK in HAFs expressing ISL1/LHX3 or miR-9/9*-124 for 12 days normalized to GAPDH expression. Error bars represent s.e.m. (*p < 0.05). (C) Representative images of HAFs expressing miR-9/9*-124 with either shCTRL or sh7SK at Day 20 immunostained for TUBB3 (red) and DAPI (blue). Scale bars, 50 μm. (D) Heatmaps of ATAC-seq signal intensity mapped to DAR (log2FC ≤ −1.5, FDR-adj. p-value < 0.01) closed between shCTRL and sh7SK conditions (n = 2,693). (E) PID 20-enriched neuronal network over PID 20 (top) and overlay of genes differentially downregulated by 7SK identified by RNA-seq (red). Insets show critical neuronal genes as hubs in the network targeted by 7SK. (F) P-values for enrichment of sh7SK-downregulated genes in each subnetwork against the mean log2FC in expression of PID20/PID0 of that subnetwork (Bonferroni-adj. p-values < 0.1; red subnetworks FC > 0.5). (G) Top GO function annotations with differentially accessible sh7SK DEGs. (H) The genomic distribution of significant (log2FC ≥ 1.5, FDR-adj. p-value < 0.01) DAR open in HAFs vs shCTRL (n=48,723). (I) IGV snapshot for ATAC- and RNA-seq signal for the neuronal gene STMN4 (sh7SK TSS-proximal DAR highlighted in pink). (J) IGV snapshot for ATAC- and RNA-seq signal for the fibroblast gene MFAP5 (shCTRL and sh7SK TSS-proximal DAR highlighted in pink). (K) Heatmaps of ATAC-seq signal intensity for miR-9/9*-124 with shCTRL or sh7SK (left) compared to miR-9/9*-124 with shCTRL or shBRG1 (right) overlapping at DAR between shCTRL and sh7SK conditions (n = 2,693). (L) Top GO function annotations for DAR-associated genes that fail to open in shBRG1 and sh7SK conditions (both comparisons: log2FC ≤−1, FDR-adj. p-value < 0.01).

