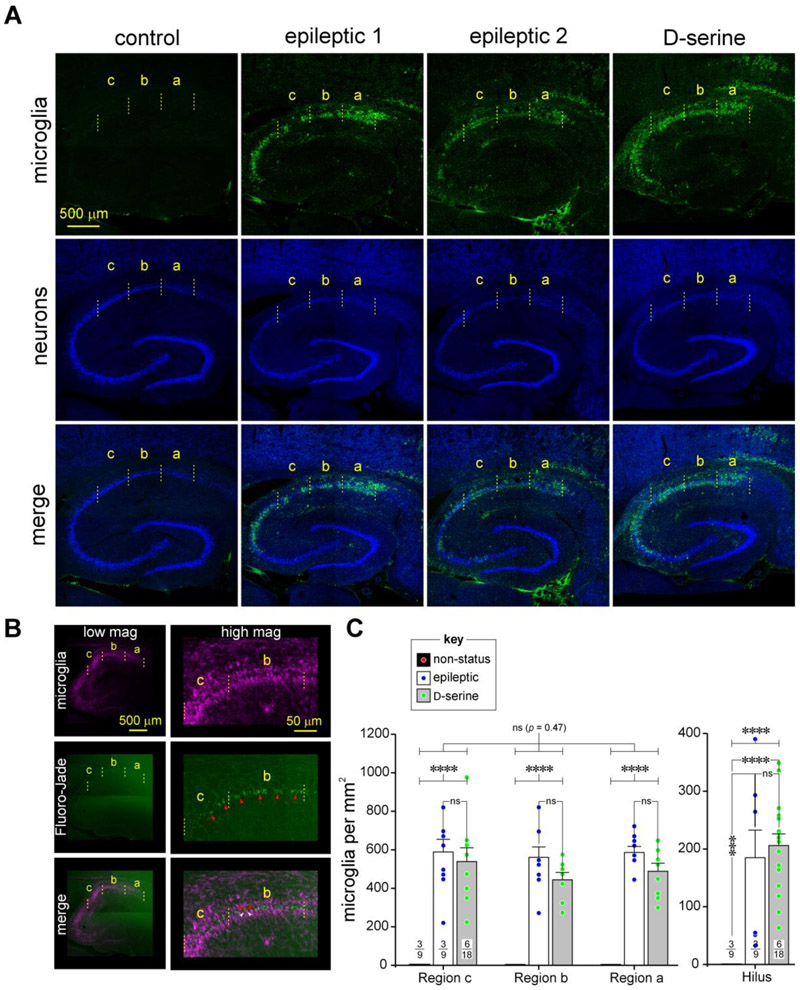
Fig 7: An assessment of microgliosis in CA1 of the hippocampus in epileptic and D-serine treated animals.
A, Immunofluorescence images of the hippocampus (top down panels) in non-status controls (left), epileptic (middle two), and post-status rats treated with D-serine (right) highlighting changes in microglial cell densities in the various subdivisions of CA1 and the hilus. Microglia immunoassayed with fluorescently tagged anti-CD11b antibody, OX-42 (green, topmost horizontal panel) and neurons with antibodies against NeuN (blue, second horizontal panel from top) shown separately (top two panels) and merged images (bottommost panel from top). Note the conspicuous infiltration and/or proliferation of microglia in the CA1 subfield of the hippocampus in the epileptic animals.
B, Co-staining of sections histologically processed for microglia (purple, topmost horizontal panel) with FluroJade (green, second horizontal panel from top), a marker of neural degeneration. Note spatial colocalization of the purple and green signals (merged images, bottom panel) in the low (left) and high (right) magnification images indicate that manifestation of microglia in the CA1 region of epileptic animals is associated with neurodegeneration.
C, Histograms of averaged microglia densities across various subdivisions of CA1 (left) and the hilus (right) under the conditions indicated in the bar plots (key: non-status controls, epileptic and D-serine-treated). Note that microglia are essentially absent in non-status control animals. Data within bar plots indicates number of animals (n) used (numerator) and the total number of sections assayed for each condition (denominator). Error bars indicate SEM. *** p < 0.001, **** p < 0.0001, ns, not significant.

