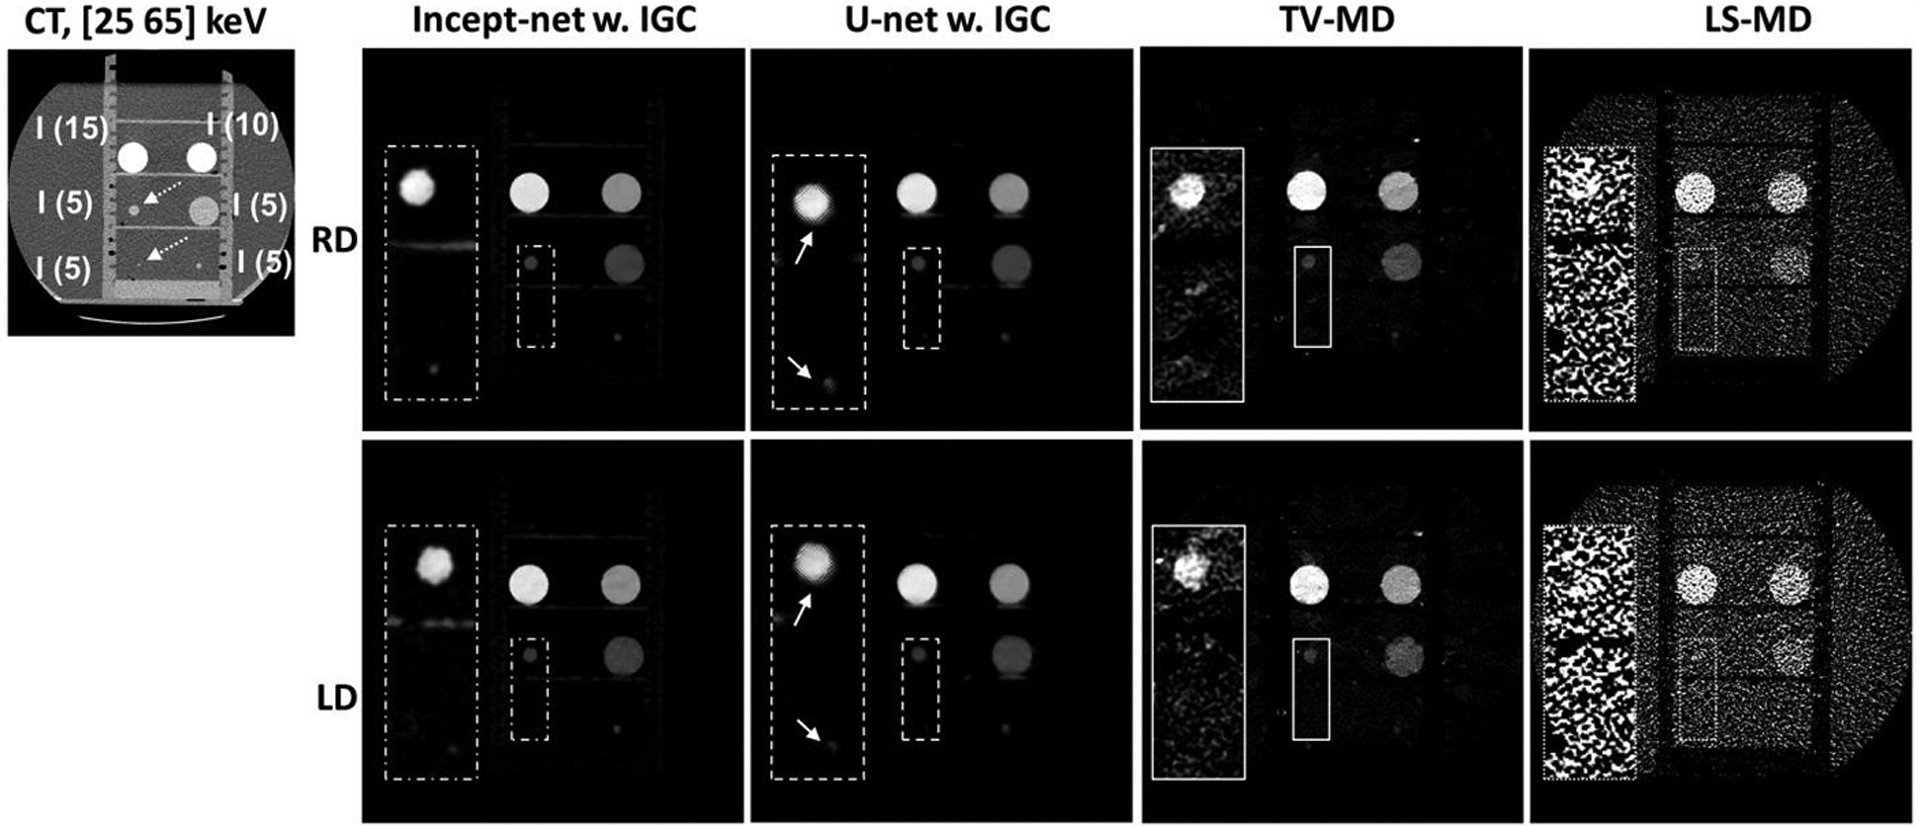
Figure 5.

Iodine images from iodine inserts at regular radiation dose (RD) and lower radiation dose (LD) levels, using Incept-net, U-net, total-variation (TV-MD) and least-square (LS-MD) based material decomposition. The inset CT image illustrates the insert configuration (the range of display window [-160 240] HU). “I” – iodine. The digits within parentheses indicate iodine mass densities (mg/cc). Of note, the top two inserts (i.e. 10 and 15 mg/cc) were involved in CNN training, but the remaining inserts (5 mg/cc) were reserved for testing. The dashed arrows indicate the location of the 5 mgI/cc iodine inserts with 2 mm and 10 mm diameter, respectively. The display window for the full field-of-view iodine images is [0, 16] mgI/cc. The zoomed inserts are 2.5 times of the size of the rectangular region-of-interest, and the corresponding display window is narrowed down to [0, 5] mgI/cc for the convenience of illustration. The solid arrows indicate the edge artifact in U-net outputs. The CTDIvol values for the regular dose (RD) and low dose (LD) scans were 13 mGy and 7 mGy, respectively.
