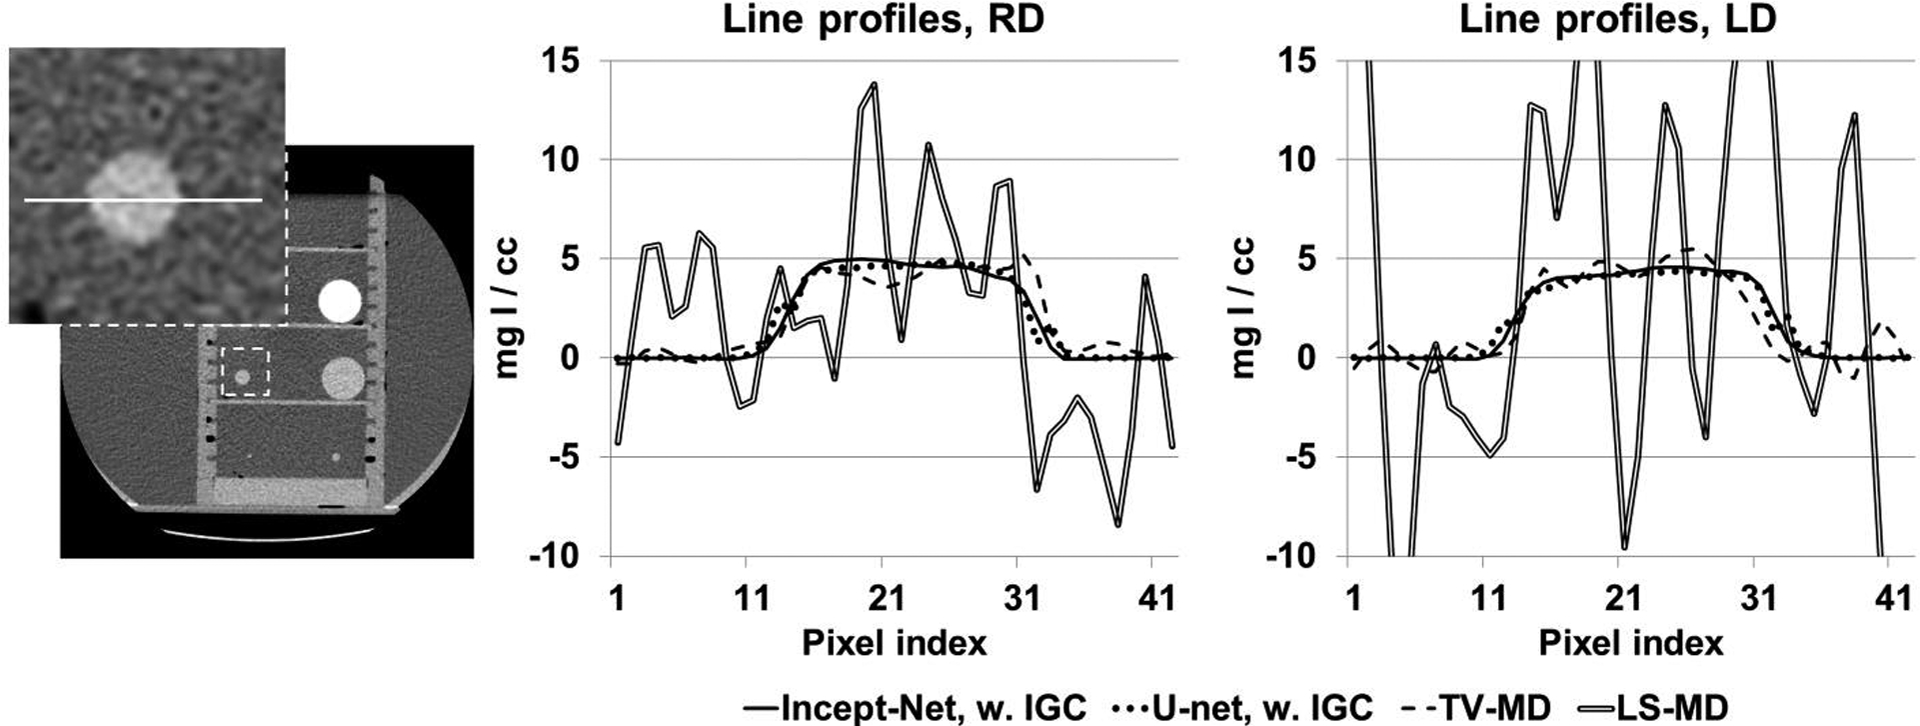
Figure 6.

Line profiles from the iodine images (see Figure 5) at routine radiation dose (RD) and low radiation dose (LD) levels, using Incept-net, U-net, total-variation-minimization (TV) and least-square (LS) based material decomposition. The inset image shows the location of line profiles in CT image, i.e. the 5 mgI/cc iodine insert (with 10 mm diameter) that was not used in CNN training. The range of display window for CT image was [-160, 240] HU.
