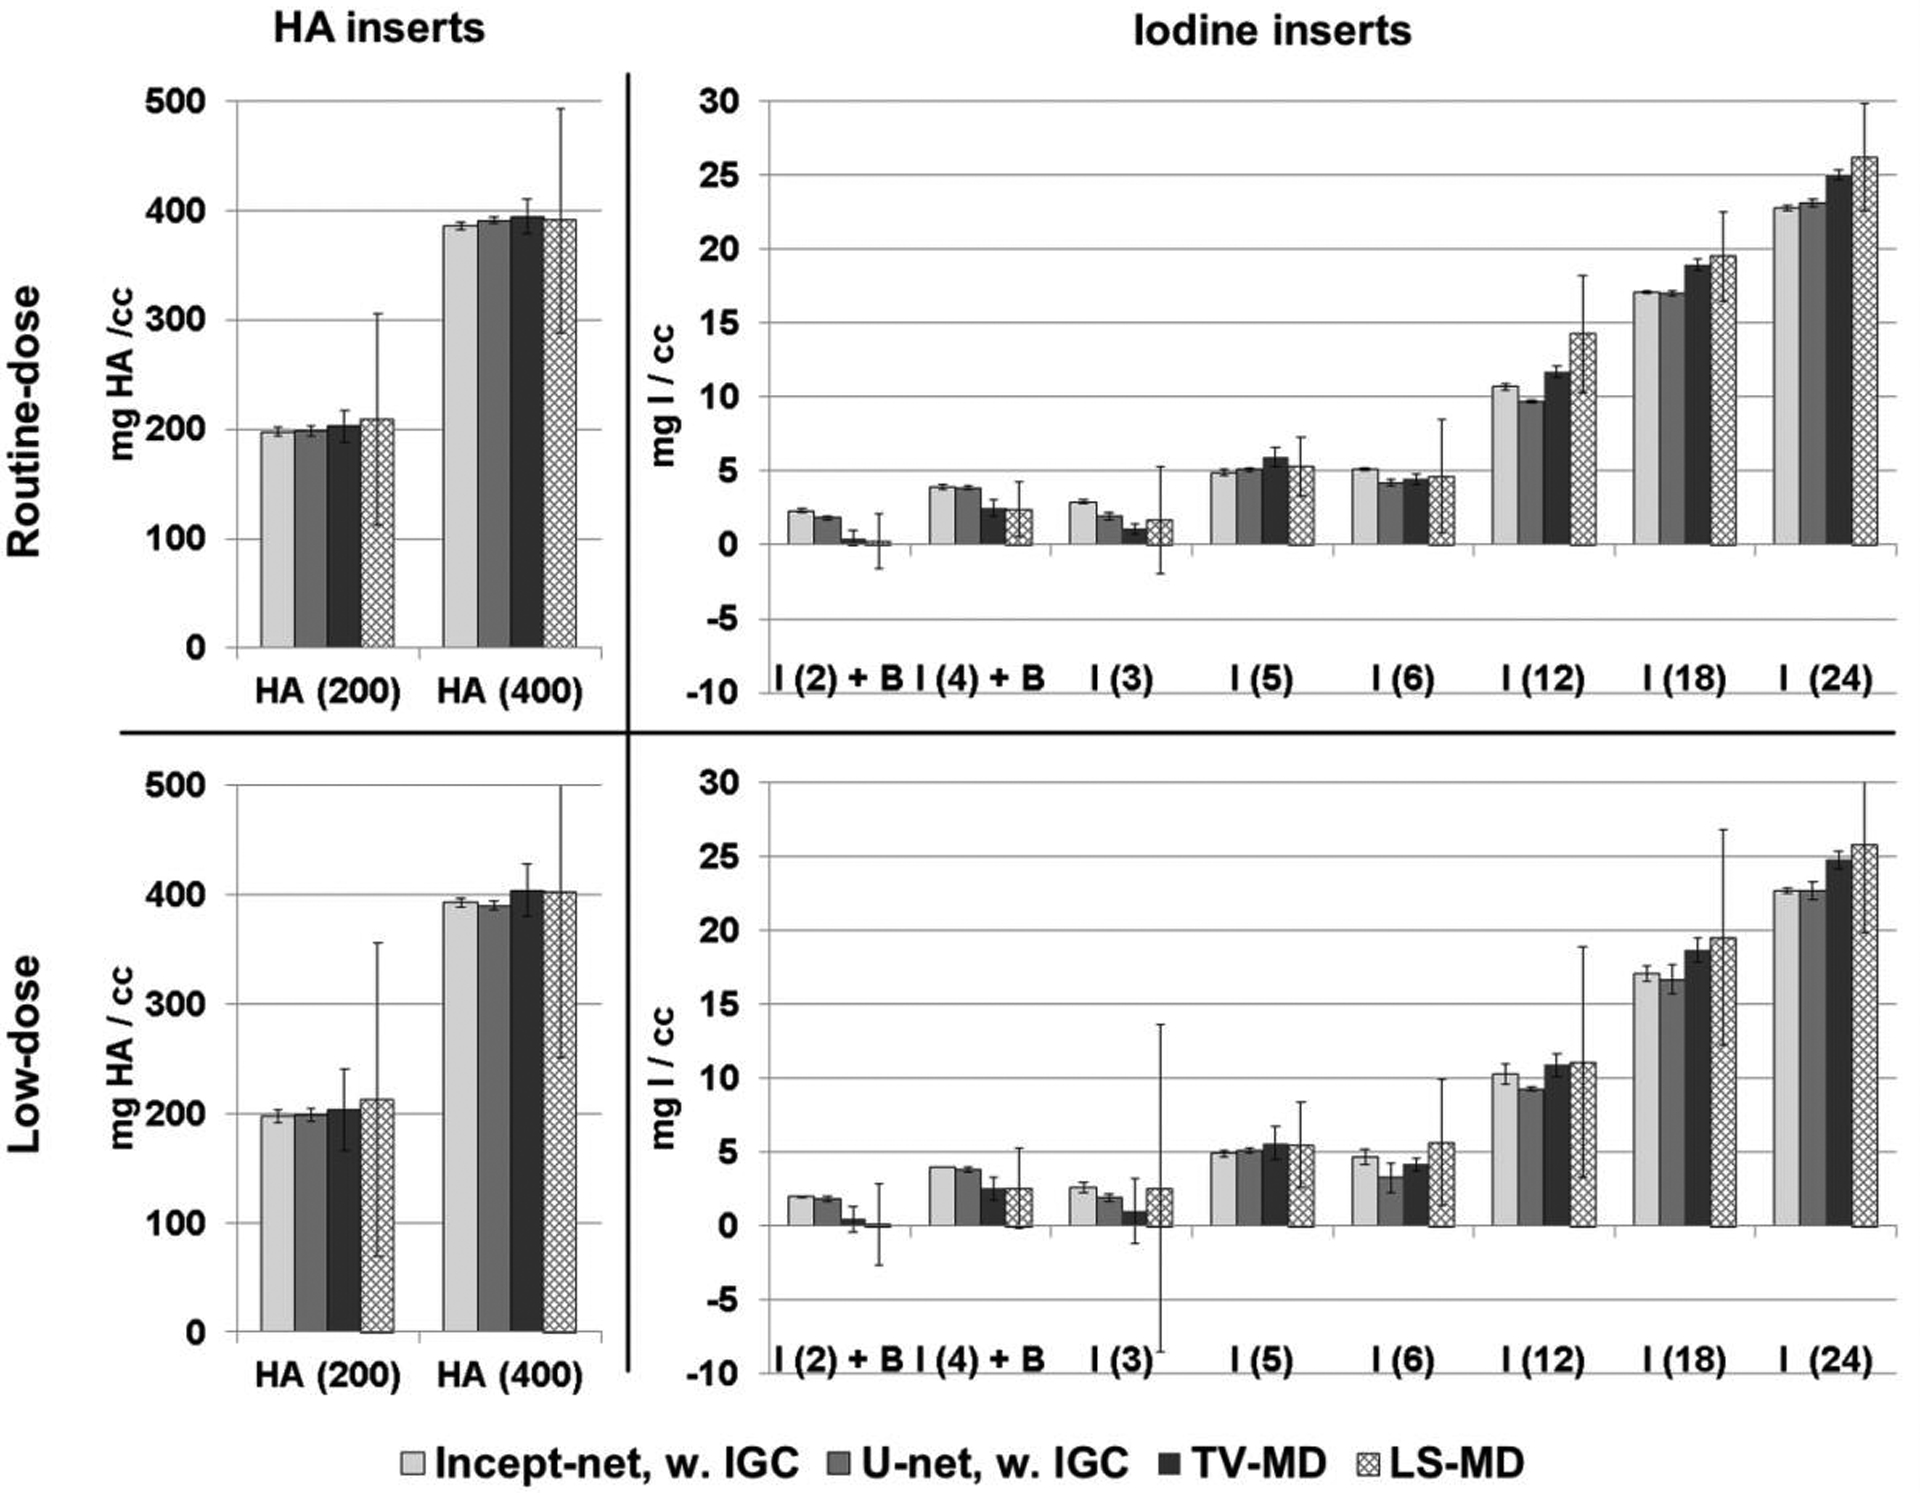
Figure 7.

Material mass densities of testing inserts estimated at routine and low dose levels, using Incept-net, U-net, total-variation (TV), and least-square (LS) based methods. The top two charts: routine dose (RD: CTDIvol 13 mGy) level. The bottom two charts: low dose (LD: CTDIvol 7 mGy) level. The error bars indicate the standard deviation of the estimated concentration.
