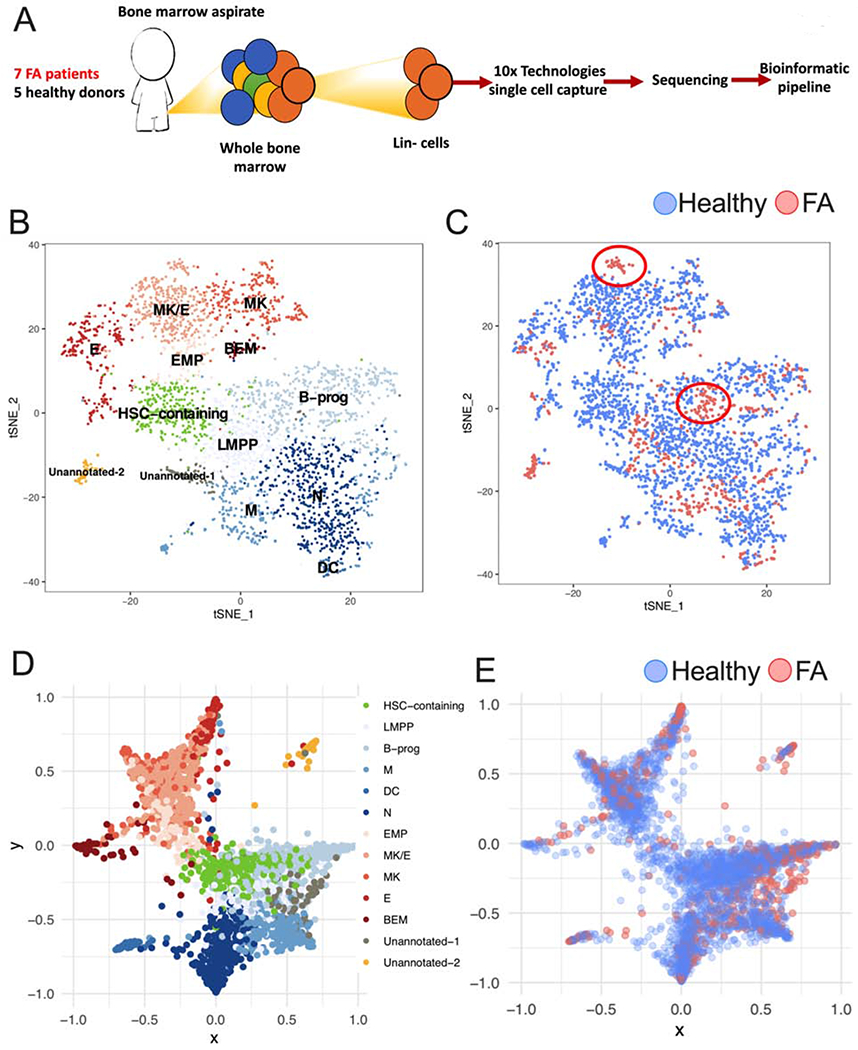
Figure 1. Single cell RNA sequencing reveals that early hematopoiesis is not perturbed in FA.

(A) Lin- cells from 7 patients with FA and 5 healthy donors (Supplementary Table 1) were individually captured, lysed and barcoded using the 10x Chromium™ controller platform. Barcoded bulk cDNA was sequenced in an Illumina platform. Unique Molecular Identifiers (UMIs) were used for sequencing deconvolution and clustering analysis, DEG analysis and lineage analysis.
(B) t-SNE plot showing the clustering analysis for CD34 expressing HSPCs. FA and healthy CD34 expressing HSPCs were combined for clustering based on their gene expression profiles. A total of 13 clusters were identified spanning the different HSPC subpopulations. Identified clusters include a HSC-containing cluster (HSC-containing); clusters with megakaryocytic-erythroid identity include: EMP (Erythroid-megakaryocyte progenitor), MK (Megakaryocyte progenitor), MK/E (common megakaryocyte/erythroid cluster), E (erythroid progenitor) and BEM (basophil, eosinophil and mast cell progenitor); clusters with lympho-myeloid identity include LMPP (lymphoid-primed multipotential progenitor), B-prog (B-cells progenitor), N (neutrophil progenitor), DC (dendritic cell progenitor) and M (monocyte progenitor). Two clusters with distinctive gene expression profiles, one of them enriched in FA cells, were assigned as “unannotated” since they required further research for identity definition.
(C) FA-derived CD34 expressing HSPCs (red dots) cluster together with healthy donors derived CD34 expressing HSPCs (blue dots). Two FA-specific sub-clusters are highlighted with circles.
(D) Lineage trajectory analysis showing that HSPC differentiation follows a star-like path. HSCs (green) located in the center region of this star follow at least two main differentiation pathways, one characterized by lympho-myeloid commitment (shades of blue), and the other characterized by megakaryocytic-erythroid commitment (shades of red). The lympho-myeloid commitment includes B, M, DC and N progenitors; the megakaryocytic-erythroid commitment spans MK, E and BEM progenitors.
(E) Projection of FA HSPCs in the lineage trajectory analysis showing that FA HSPCs follow the same differentiation star-like profile as healthy cells do. FA HSPCs (red dots), healthy HSPCs (blue dots).
See also Supplementary Figure 1.
Supplementary Table 1 describes the characteristics of heathy donors and FA patients whose bone marrow samples were used for the experiments described in panels A-E.
