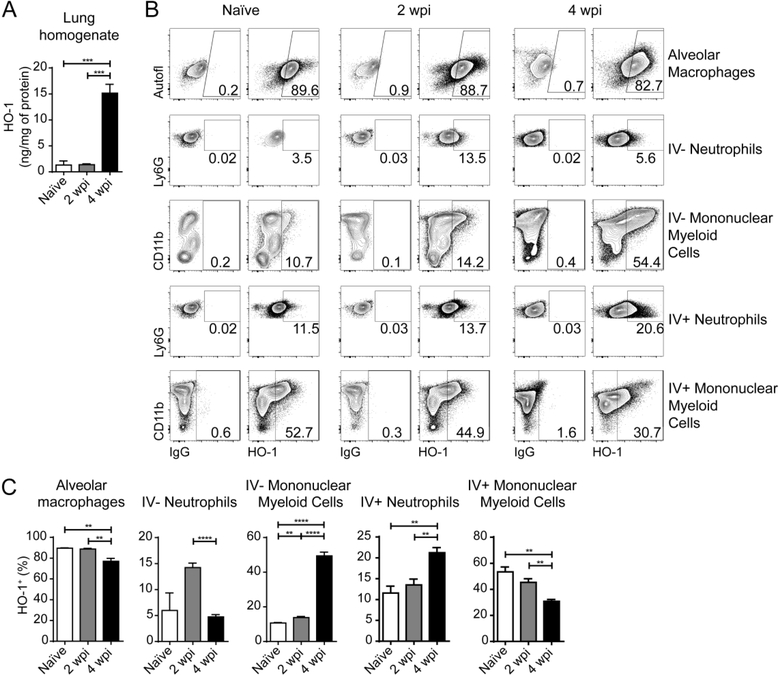
Figure 1: HO-1 is upregulated mainly in parenchymal and alveolar mononuclear myeloid cells in the lungs of M. tuberculosis-infected mice.
(A) HO-1 concentration measured by ELISA in lung homogenates obtained from naïve, or M. tuberculosis-infected mice at 2 and 4 weeks post-infection (wpi) (n = 4 mice/group); (B) Representative dot plots showing HO-1 staining in the right hand columns and correspondent negative control on the left hand columns in alveolar macrophages, parenchymal / alveolar (IV−) neutrophils and mononuclear myeloid cells as well as intravascular (IV+) neutrophils, and mononuclear myeloid cells, from lungs of naïve or M. tuberculosis-infected mice at 2 and 4 wpi, gated as detailed in Fig. S1 (flow cytometry data concatenated from 4 samples) (C) Frequencies of HO-1+ alveolar macrophages, parenchymal / alveolar (IV−) neutrophils and mononuclear myeloid cells as well as intravascular (IV+) neutrophils, and mononuclear myeloid cells, measured by flow cytometry in lungs of naïve or M. tuberculosis-infected mice at 2 and 4 wpi, gated as detailed in Fig. S1. Data shown are representative of 3 independent experiments. Statistical analysis: unpaired Student’s t test. ** = p<0.01, *** = p<0.001, **** = p<0.0001, n.s = non-significant.

