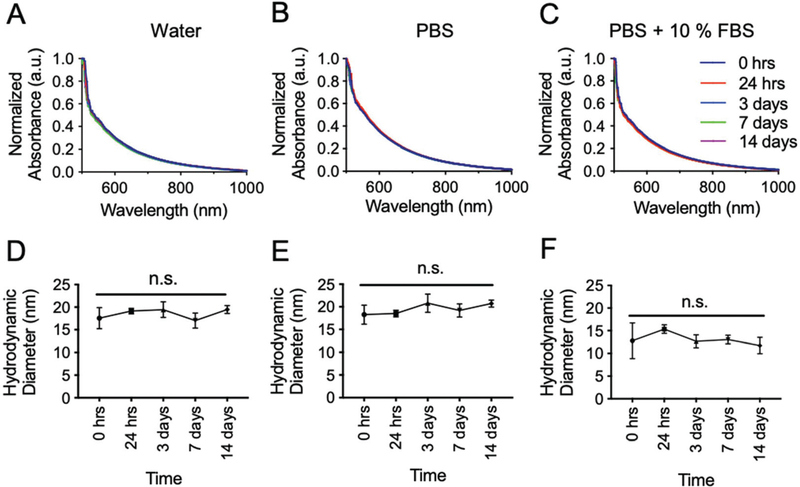
Fig. 3.
UV-Vis spectra of Ag2Te nanoparticles incubated in (A) DI water, (B) PBS and (C) PBS + 10% FBS for 14 days. The dark blue curve shows data from day 0, red from 24 h, blue from 3 days, green from 7 days, and purple from 14 days post-incubation in the different media. The hydrodynamic diameter of Ag2Te nanoparticles in (D) DI water, (E) PBS, and (F) PBS + 10% FBS. Data is presented as the mean, while the error bars represent standard deviations.

