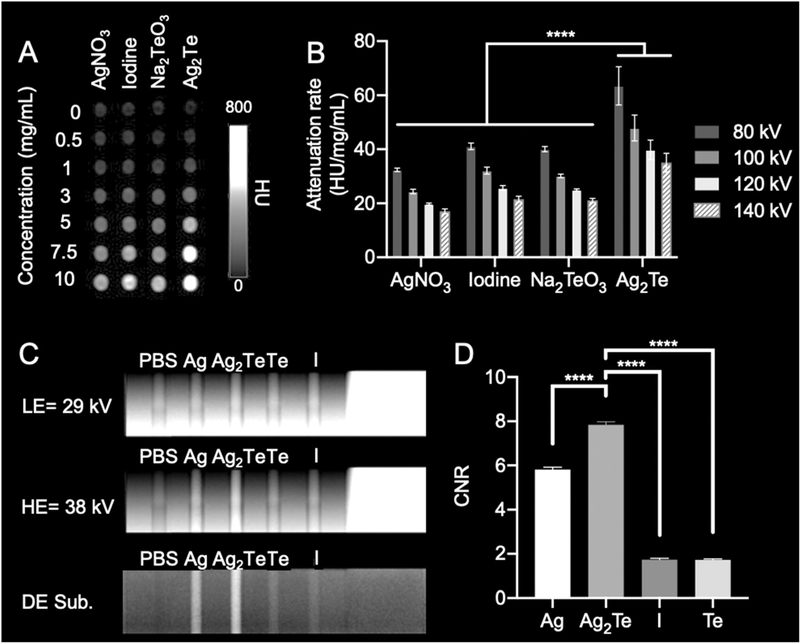
Fig. 5.
In vitro imaging with CT and DEM. (A) CT phantom image at an energy of 80 kV. (B) Quantification of the CT attenuation rate of the different solutions at different energies. Error bars represent standard deviation. (C) DEM phantom imaging at a LE of 29 kV, HE of 38 kV, and DEM subtraction image. (D) DEM phantom image contrast-to-noise ratio (CNR) quantification. ****P ≤ 0.0001. Ag denotes AgNO3 salt, Te denotes Na2TeO3 salt, and I denotes iopamidol. PBS was used as a negative control. The different solutions had a concentration of 10 mg of the element of interest per mL (Ag2Te NPs had a concentration of 10 mg of Ag mL−1 to facilitate comparison).

