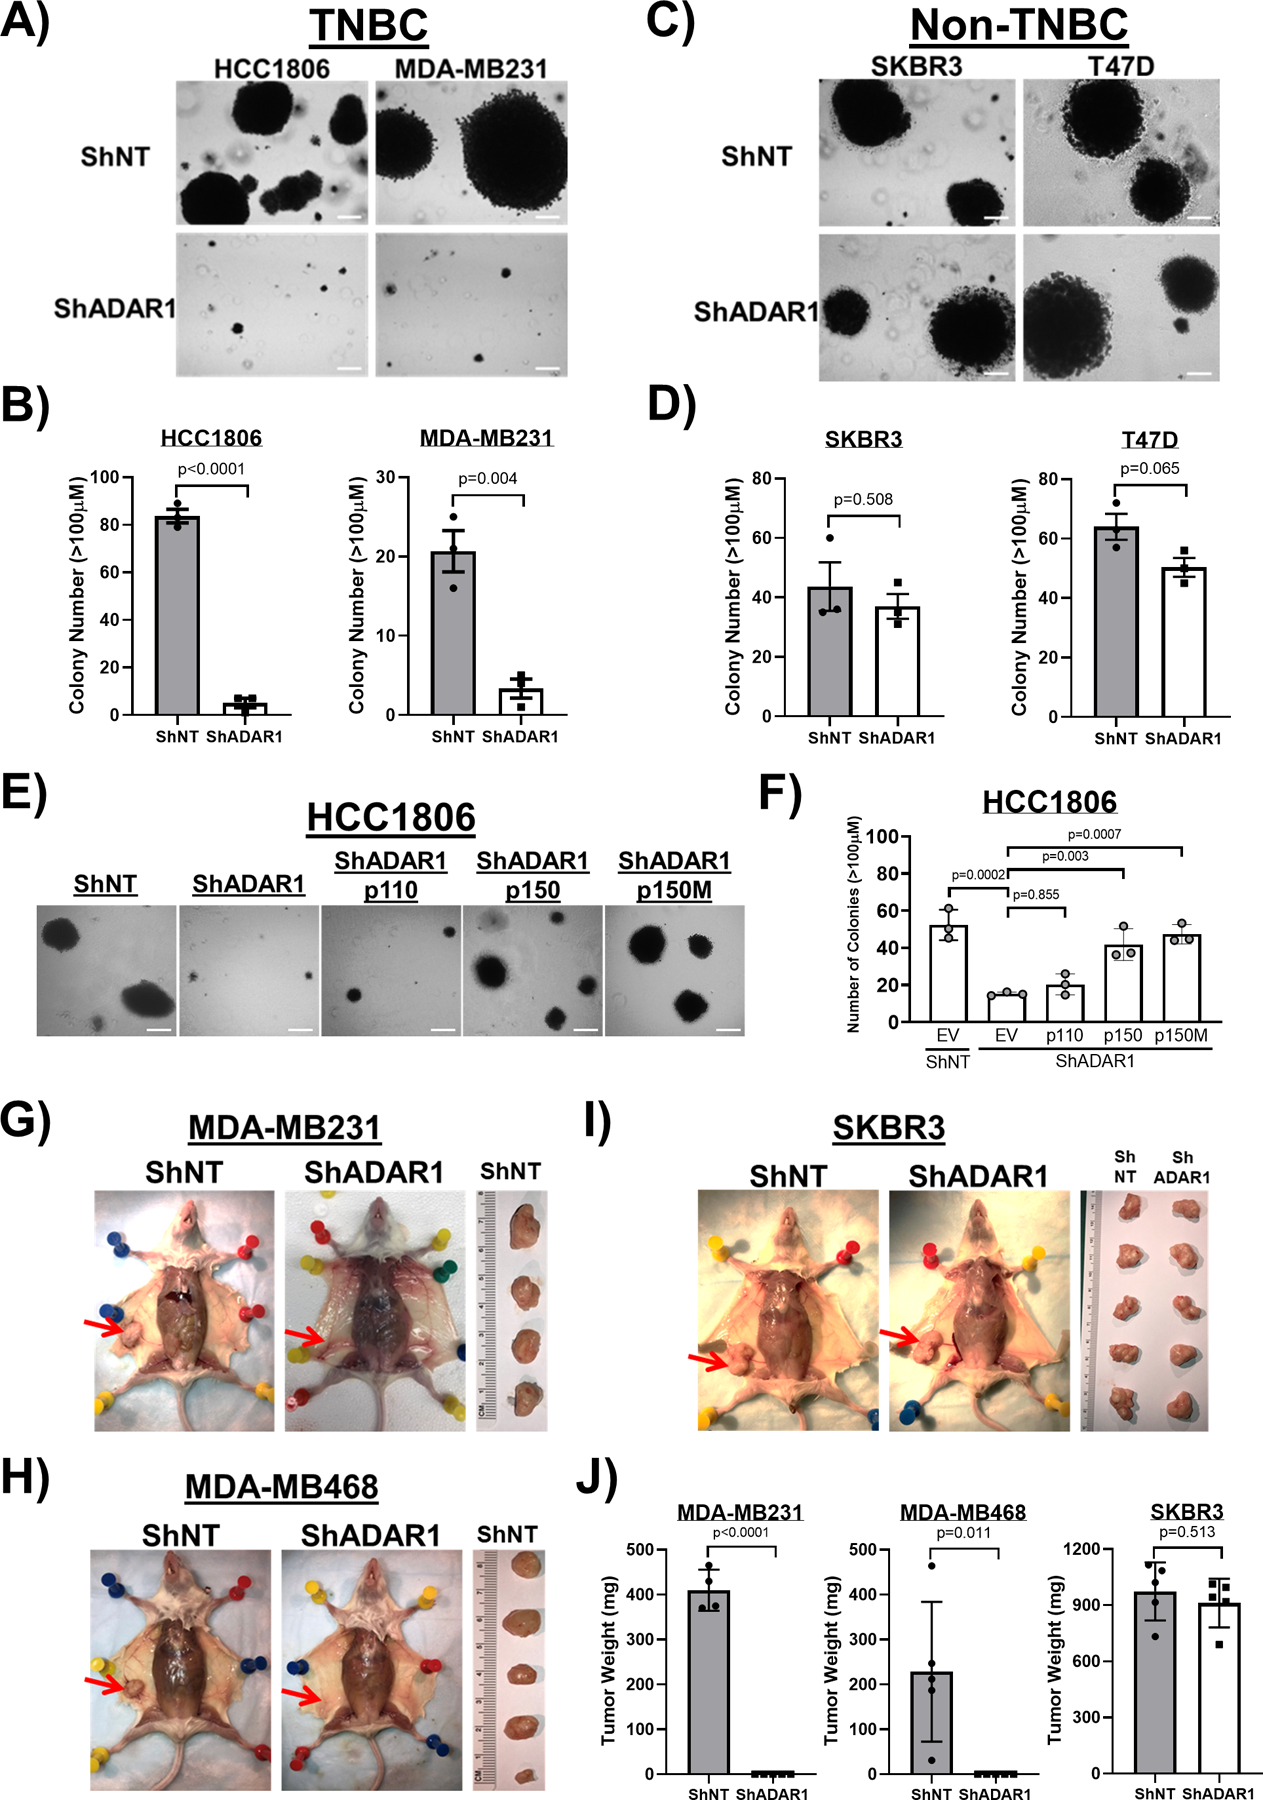
Figure 3: ADAR1 is required for TNBC transformation and tumorigenesis.

A) Soft agar assay (SAA) showing that ADAR1-knockdown reduced anchorage-independent growth of TNBC cells (HCC1806 and MDA-MB231). Images are representative, N=3. Scale-bar, 100μM. B) Quantification of SAA in A). Colonies bigger than 100μM in diameter were counted. Data are represented as mean ± SD, N=3. C) SAA showing that ADAR1-knockdown did not affect anchorage-independent growth of Non-TNBC cells (SKBR3 and T47D). Images are representative, N=3. Scale-bar, 100μM. D) Quantification of SAA in C). Colonies bigger than 100μM in diameter were counted. Data are represented as mean ± SD, N=3. E) SAA showing that overexpression of p150 and p150M, but not p110, partially rescued reduced anchorage-independent growth of HCC1806 cells due to ADAR1-knockdown. Images are representative, N=3. Scale-bar, 100μM. F) Quantification of SAA in E). Colonies bigger than 100μM in diameter were counted. Data are represented as mean ± SD, N=3. G) Orthotopic implantation of MDA-MB231 cells into abdominal mammary fat pad. Tumors were removed from the mice ~4 weeks post injection and weighed (ShNT, N=4; ShADAR1, N=5). Red arrows indicate the location of mammary fat pad. H) Orthotopic implantation of MDA-MB468 cells into abdominal mammary fat pad. Tumors were removed from the mice ~12 weeks post injection and weighed (N=5). Red arrows indicate the location of mammary fat pad. I) Orthotopic implantation of SKBR3 cells into abdominal mammary fat pad. Tumors were removed from the mice ~4 weeks post injection and weighed (N=5). Red arrows indicate the location of mammary fat pad. J) Quantification of the result shown in G)–I). Data are represented as mean ± SD.
