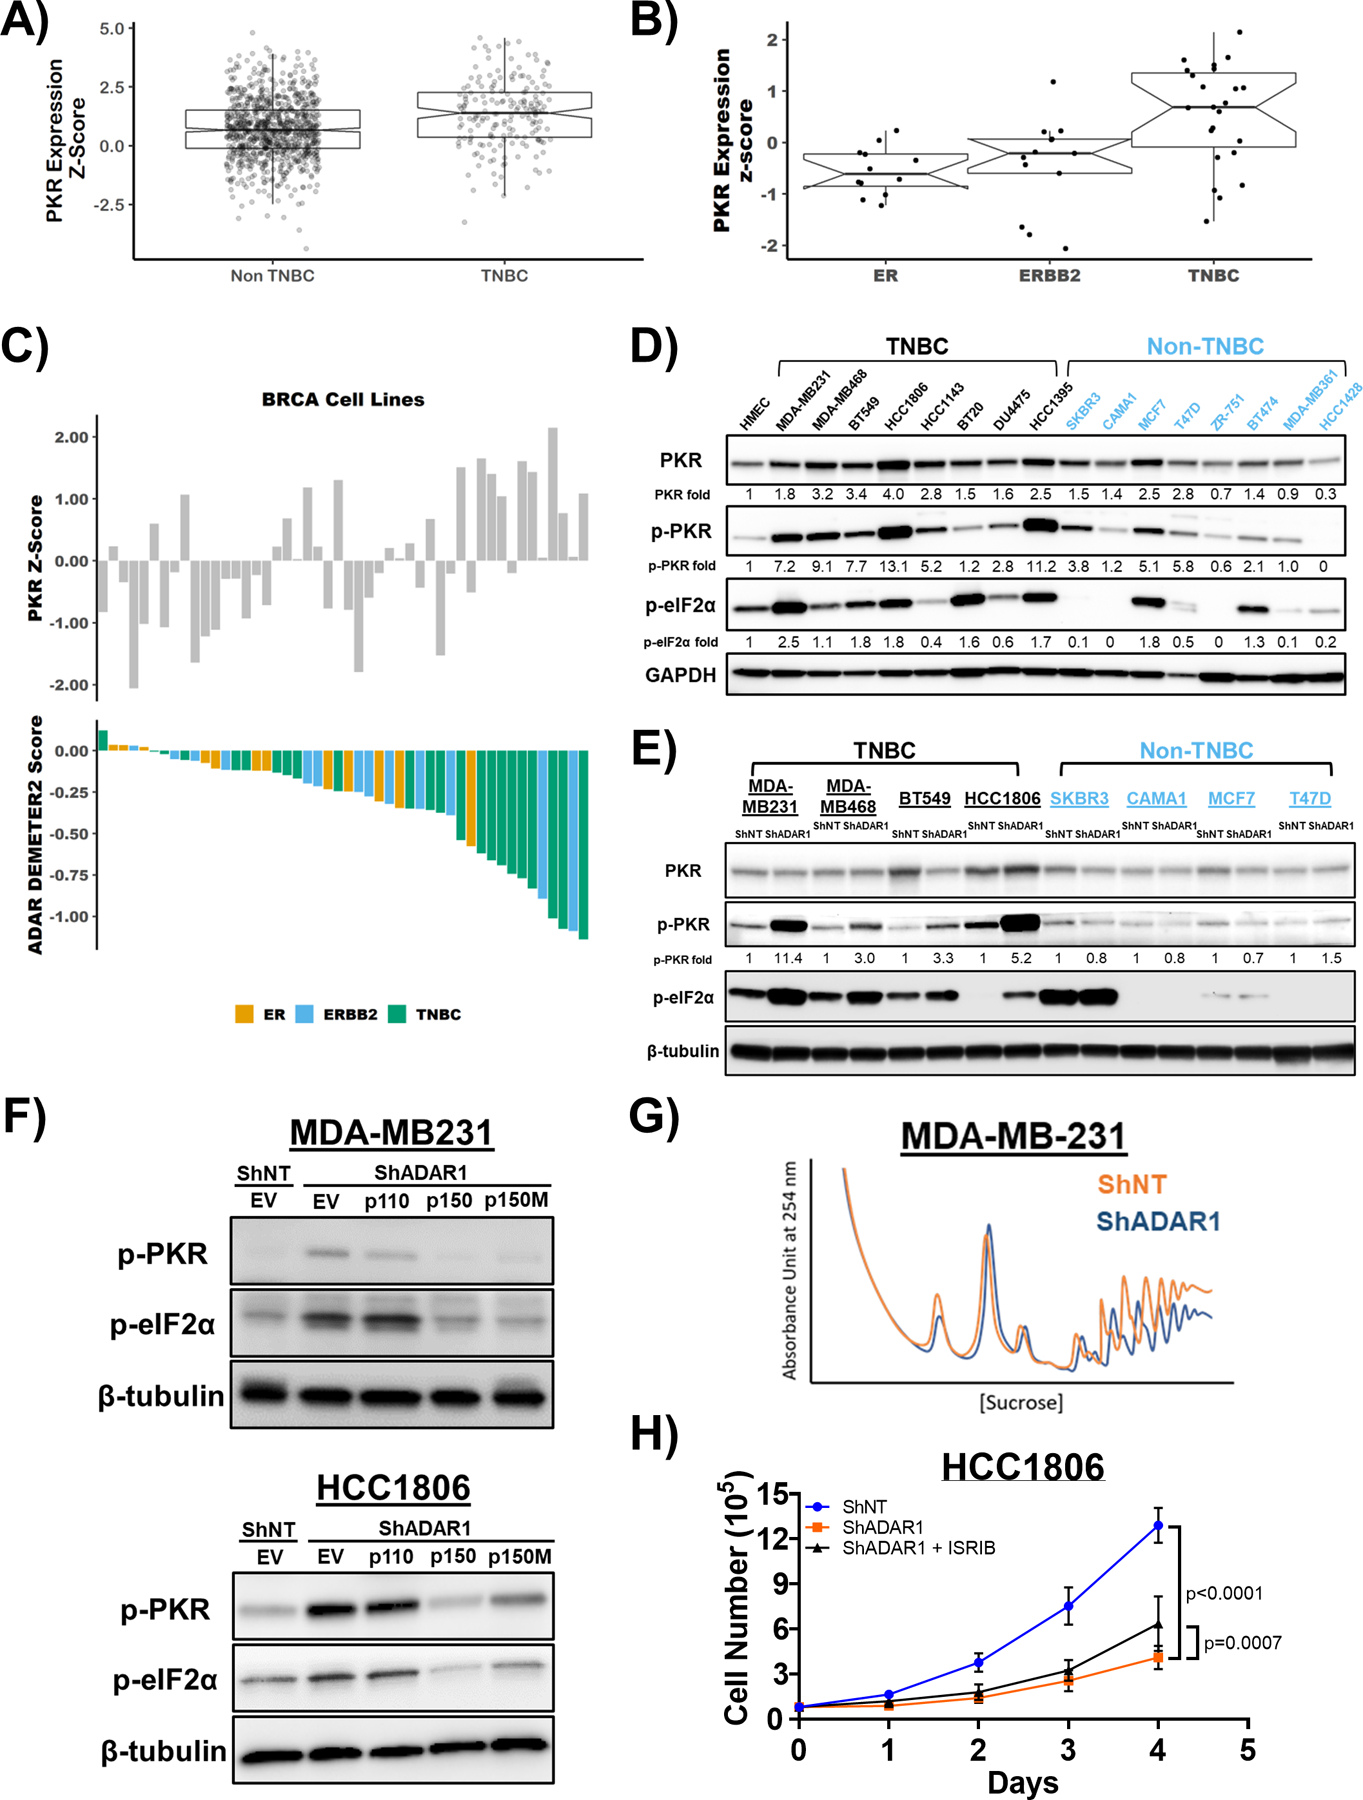
Figure 4: PKR is overexpressed in TNBC and activated upon ADAR loss.

A) mRNA expression of PKR in TNBC and Non-TNBC. Data were extracted from TCGA database. B) mRNA expression of PKR in ER-positive, ERBB2(HER2)-positive and TNBC cell lines. Data were extracted from CCLE database. C) ADAR1-dependency score positively correlates with PKR expression. Upper panel: PKR expression z-score in breast cancer cell lines. Lower panel: ADAR1-dependency scores. Lower DEMETER2 scores indicate stronger ADAR1-dependency. D) Immunoblots showing protein levels of PKR, p-PKR (T446), p-eIF2α (S51) and GAPDH (loading control) in breast cancer cell lines. Densitometry quantification of gel images was normalized to GAPDH and set relative to HMEC signal. Data shown are representative, N=3. E) Immunoblots showing protein levels of PKR, p-PKR (T446), p-eIF2α (S51) and β-tubulin (loading control) in TNBC and non-TNBC breast cancer cell lines with or without ADAR1-knockdown. Densitometry quantification of gel images was normalized to GAPDH and compared to HMEC signal set as 1-fold. Data shown are representative, N=3. F) Immunoblots showing protein levels of p-PKR (T446), p-eIF2α (S51) and β-tubulin (loading control) with overexpression of p150, p110 or editing-defective p150E912A (p150M) in ShADAR1-treated MDA-MB231 and HCC1806 cells. Data shown are representative, N=3. G) Polysome profiling of MDA-MB231 cells with or without ADAR1-knockdown. Data shown are representative of three replicates. H) Cell proliferation assay showing that treatment of ISRIB (5nM) resulted in a modest rescue of ADAR1-knockdown phenotype in HCC1806 cells. Data are represented as mean ± SD. N=3.
