
Figure 3. MD of the Chromatosomes.
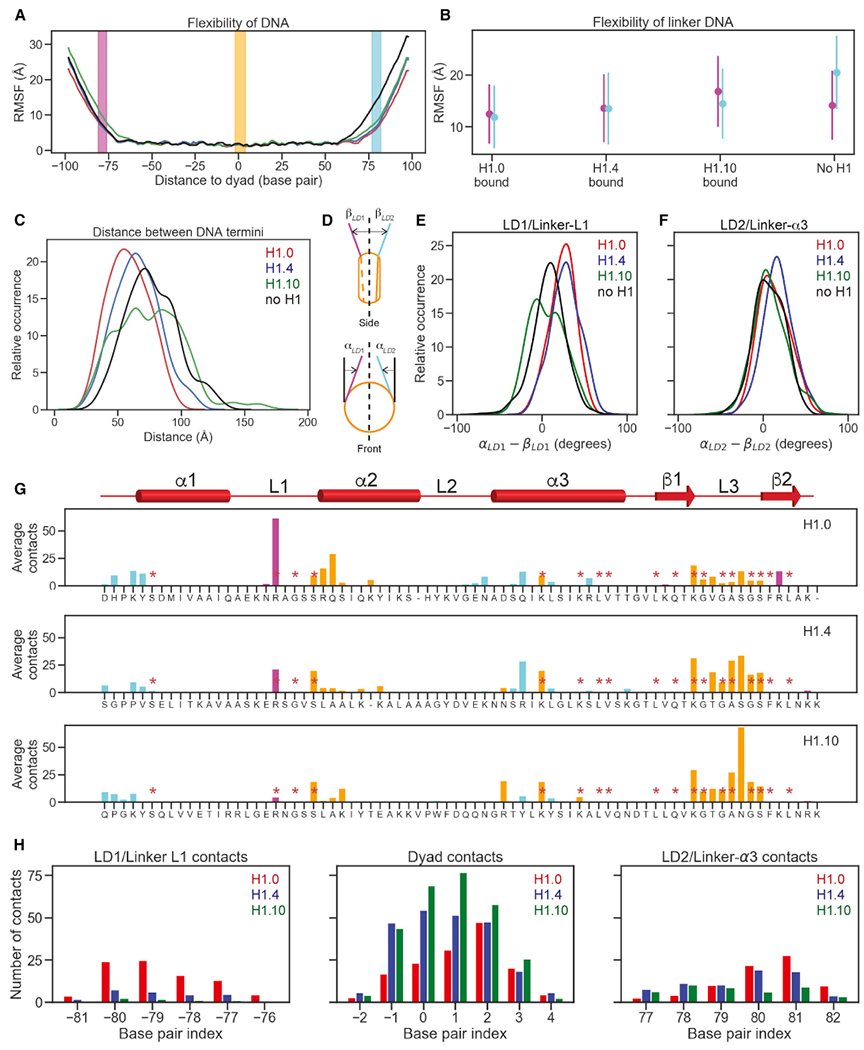
(A) Flexibility of DNA in the H1.0 (red), H1.4 (blue), H1.10 (green) chromatosomes, and free nucleosome (black) were illustrated via phosphate atom RMSFs over full molecular dynamics (MD) trajectories. Base pairs that contact globular domains are shown by DNA region: linker DNA 1 (LD1)/linker-L1 (magenta), dyad (orange), and linker DNA 2 (LD2)/linker-α3 (cyan). All panels follow this color convention. The dyad is numbered as 0.
(B) Mean and standard deviations of DNA RMSF averaged over base pairs.
(C) Distribution of distances between the two terminal base pairs of DNA.
(D) Cartoon illustrating the definition of linker strand opening angles, αLD1 and αLD2 for in-nucleosomal-plane motion (top), and βLD1 and βLD2 for out-of-nucleosomal-plane motion.
(E) Distributions of differences of linker strand angles, α and β for LD1/linker-L1. Higher values point to more compact structures.
(F) Distributions of differences of linker strand angles, α and β for LD2/ linker-α3. Higher values point to more compact structures
(G) The number of heavy-atom contacts between the globular domain and DNA averaged over MD trajectories. Residues conserved across all three H1 variants are annotated with red asterisks. Residues in contacts with LD1/linker-L1, dyad region, and LD2/linker-α3 are shown in purple, orange, and cyan, respectively.
(H) Average numbers of heavy-atom contacts for three DNA regions.
See also Figure S3.