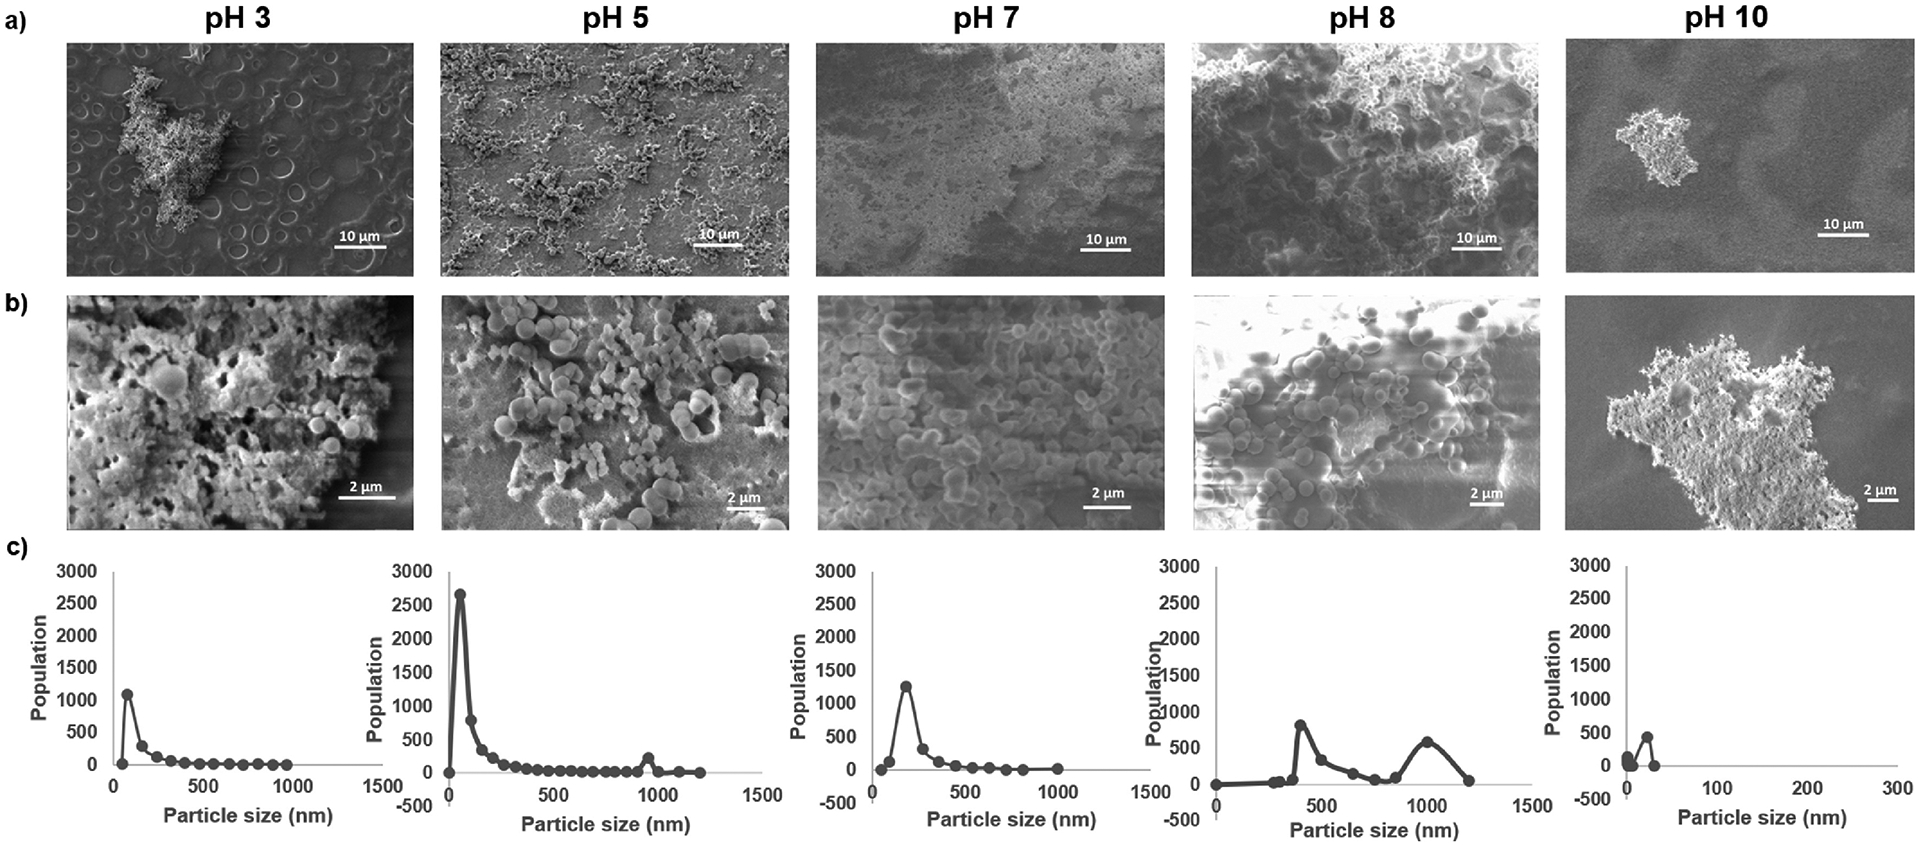
Figure 2 –

Analysis of silica nanoparticle deposition and distribution at different pH values. a) Representative SEM images showing the surface coverage of silica nanoparticles deposited after biosilicification at different pH, and b) representative magnifications used for nanoparticle size quantification. c) Quantification of silica particle size distribution after biosilicification at different pHs. The graph shows the quantification of three different images.
