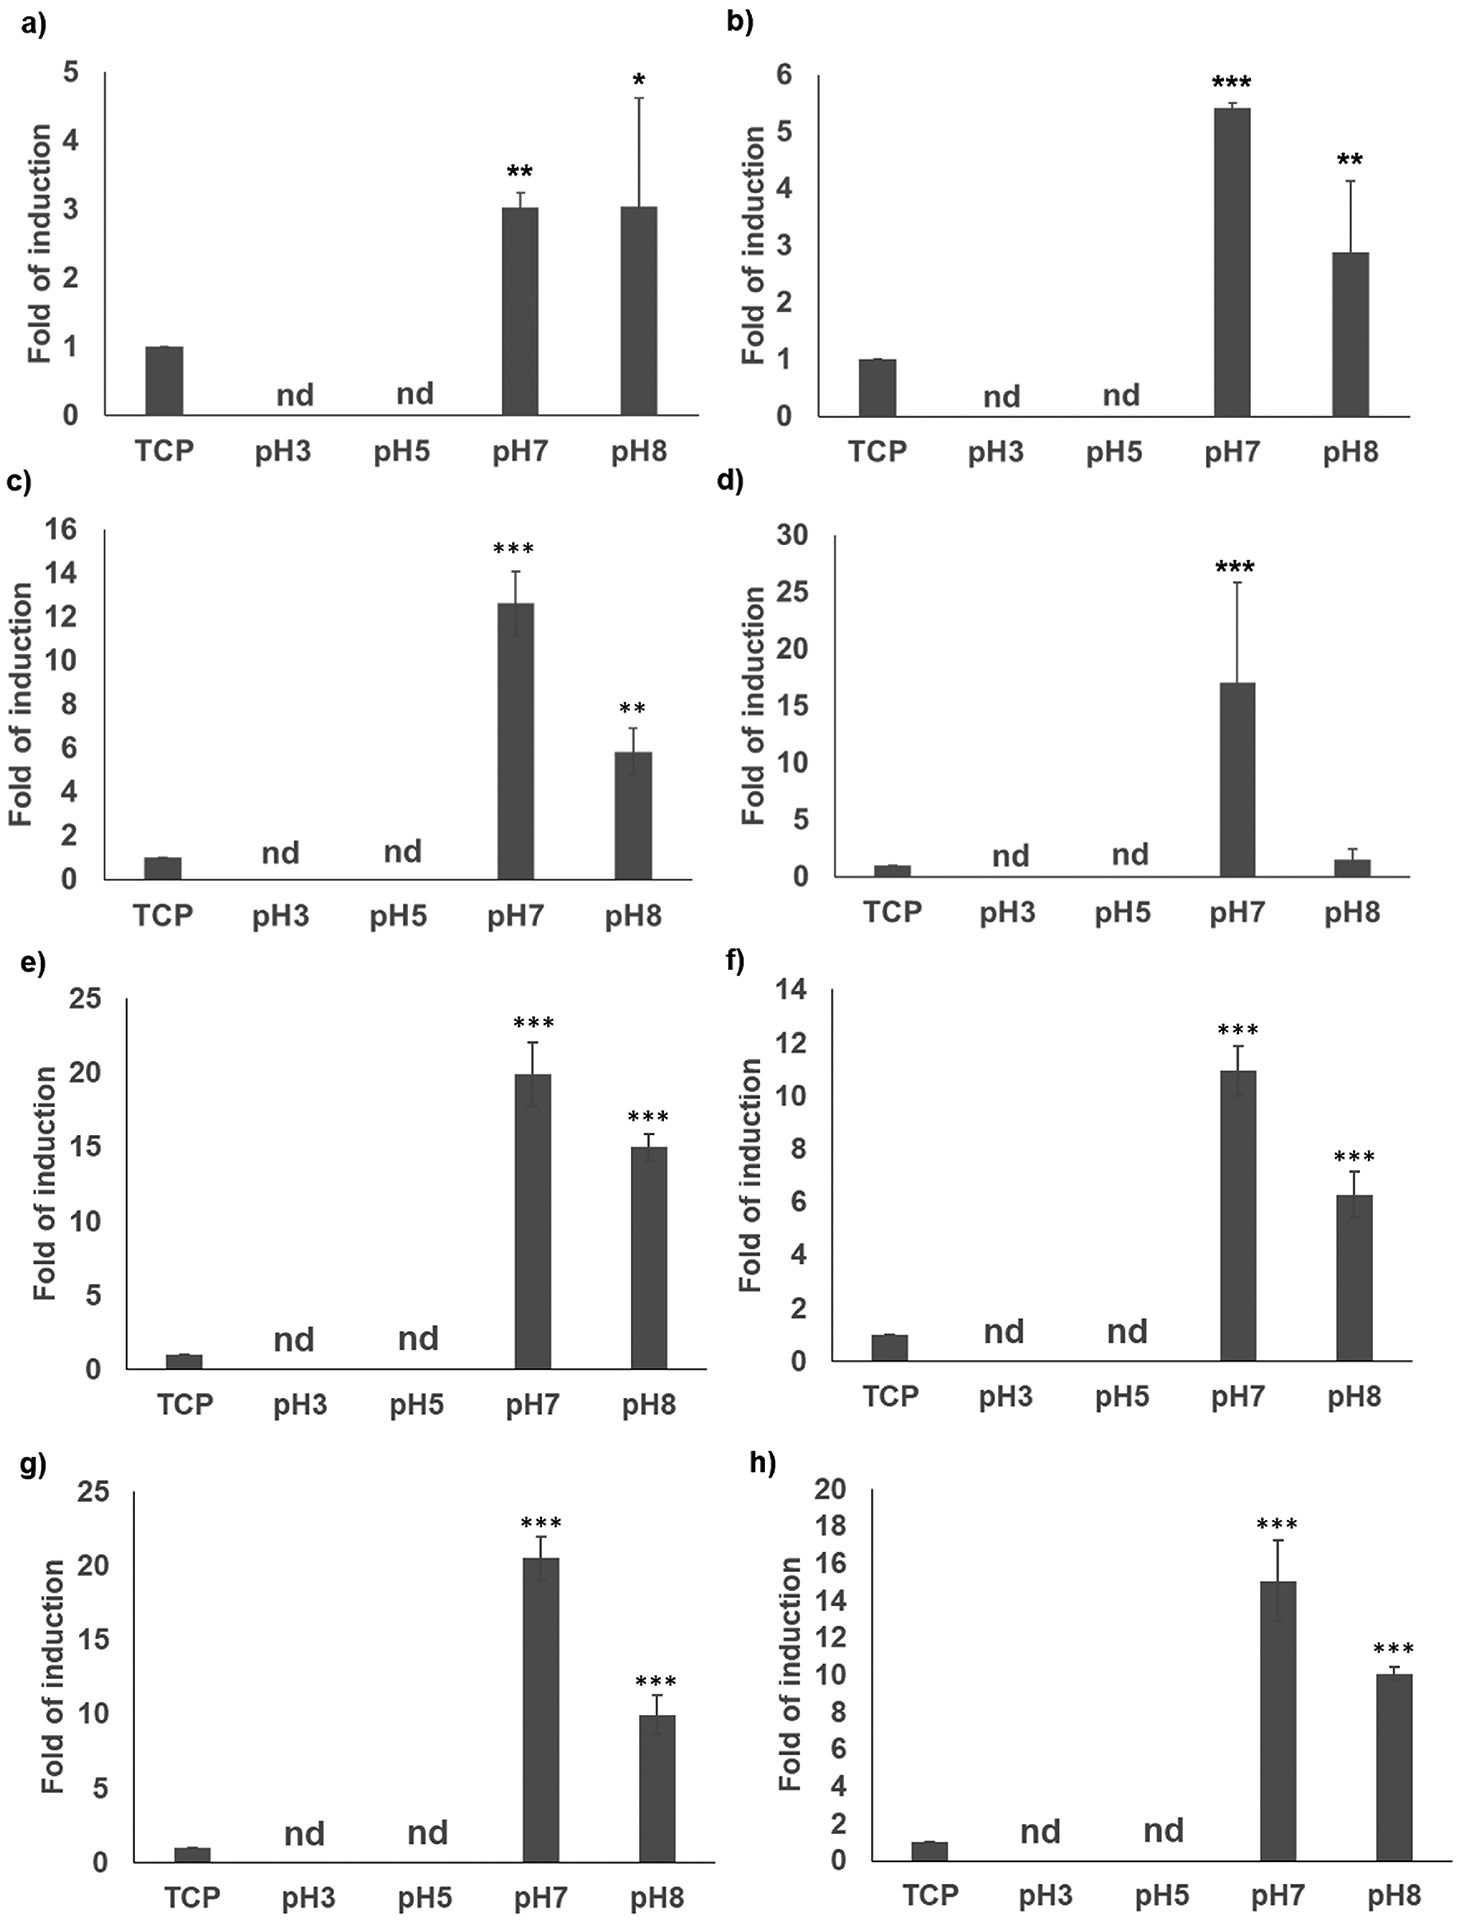
Figure 3 -.

Gene expression of αV integrin subunit (a,e), Runx2 (b,f), collagen I (c,g), and BSP (d,h) markers of hMSCs seeded for 24 h (a-d) or 7 days (e-h) on tissue culture plastic (TPC), and R5–15mer-ch films silicified at different pHs. “nd” stands for not detected. Data represents mean ± SE (n=3) *: p<0.05; **: p <0.01; ***: p <0.001.
