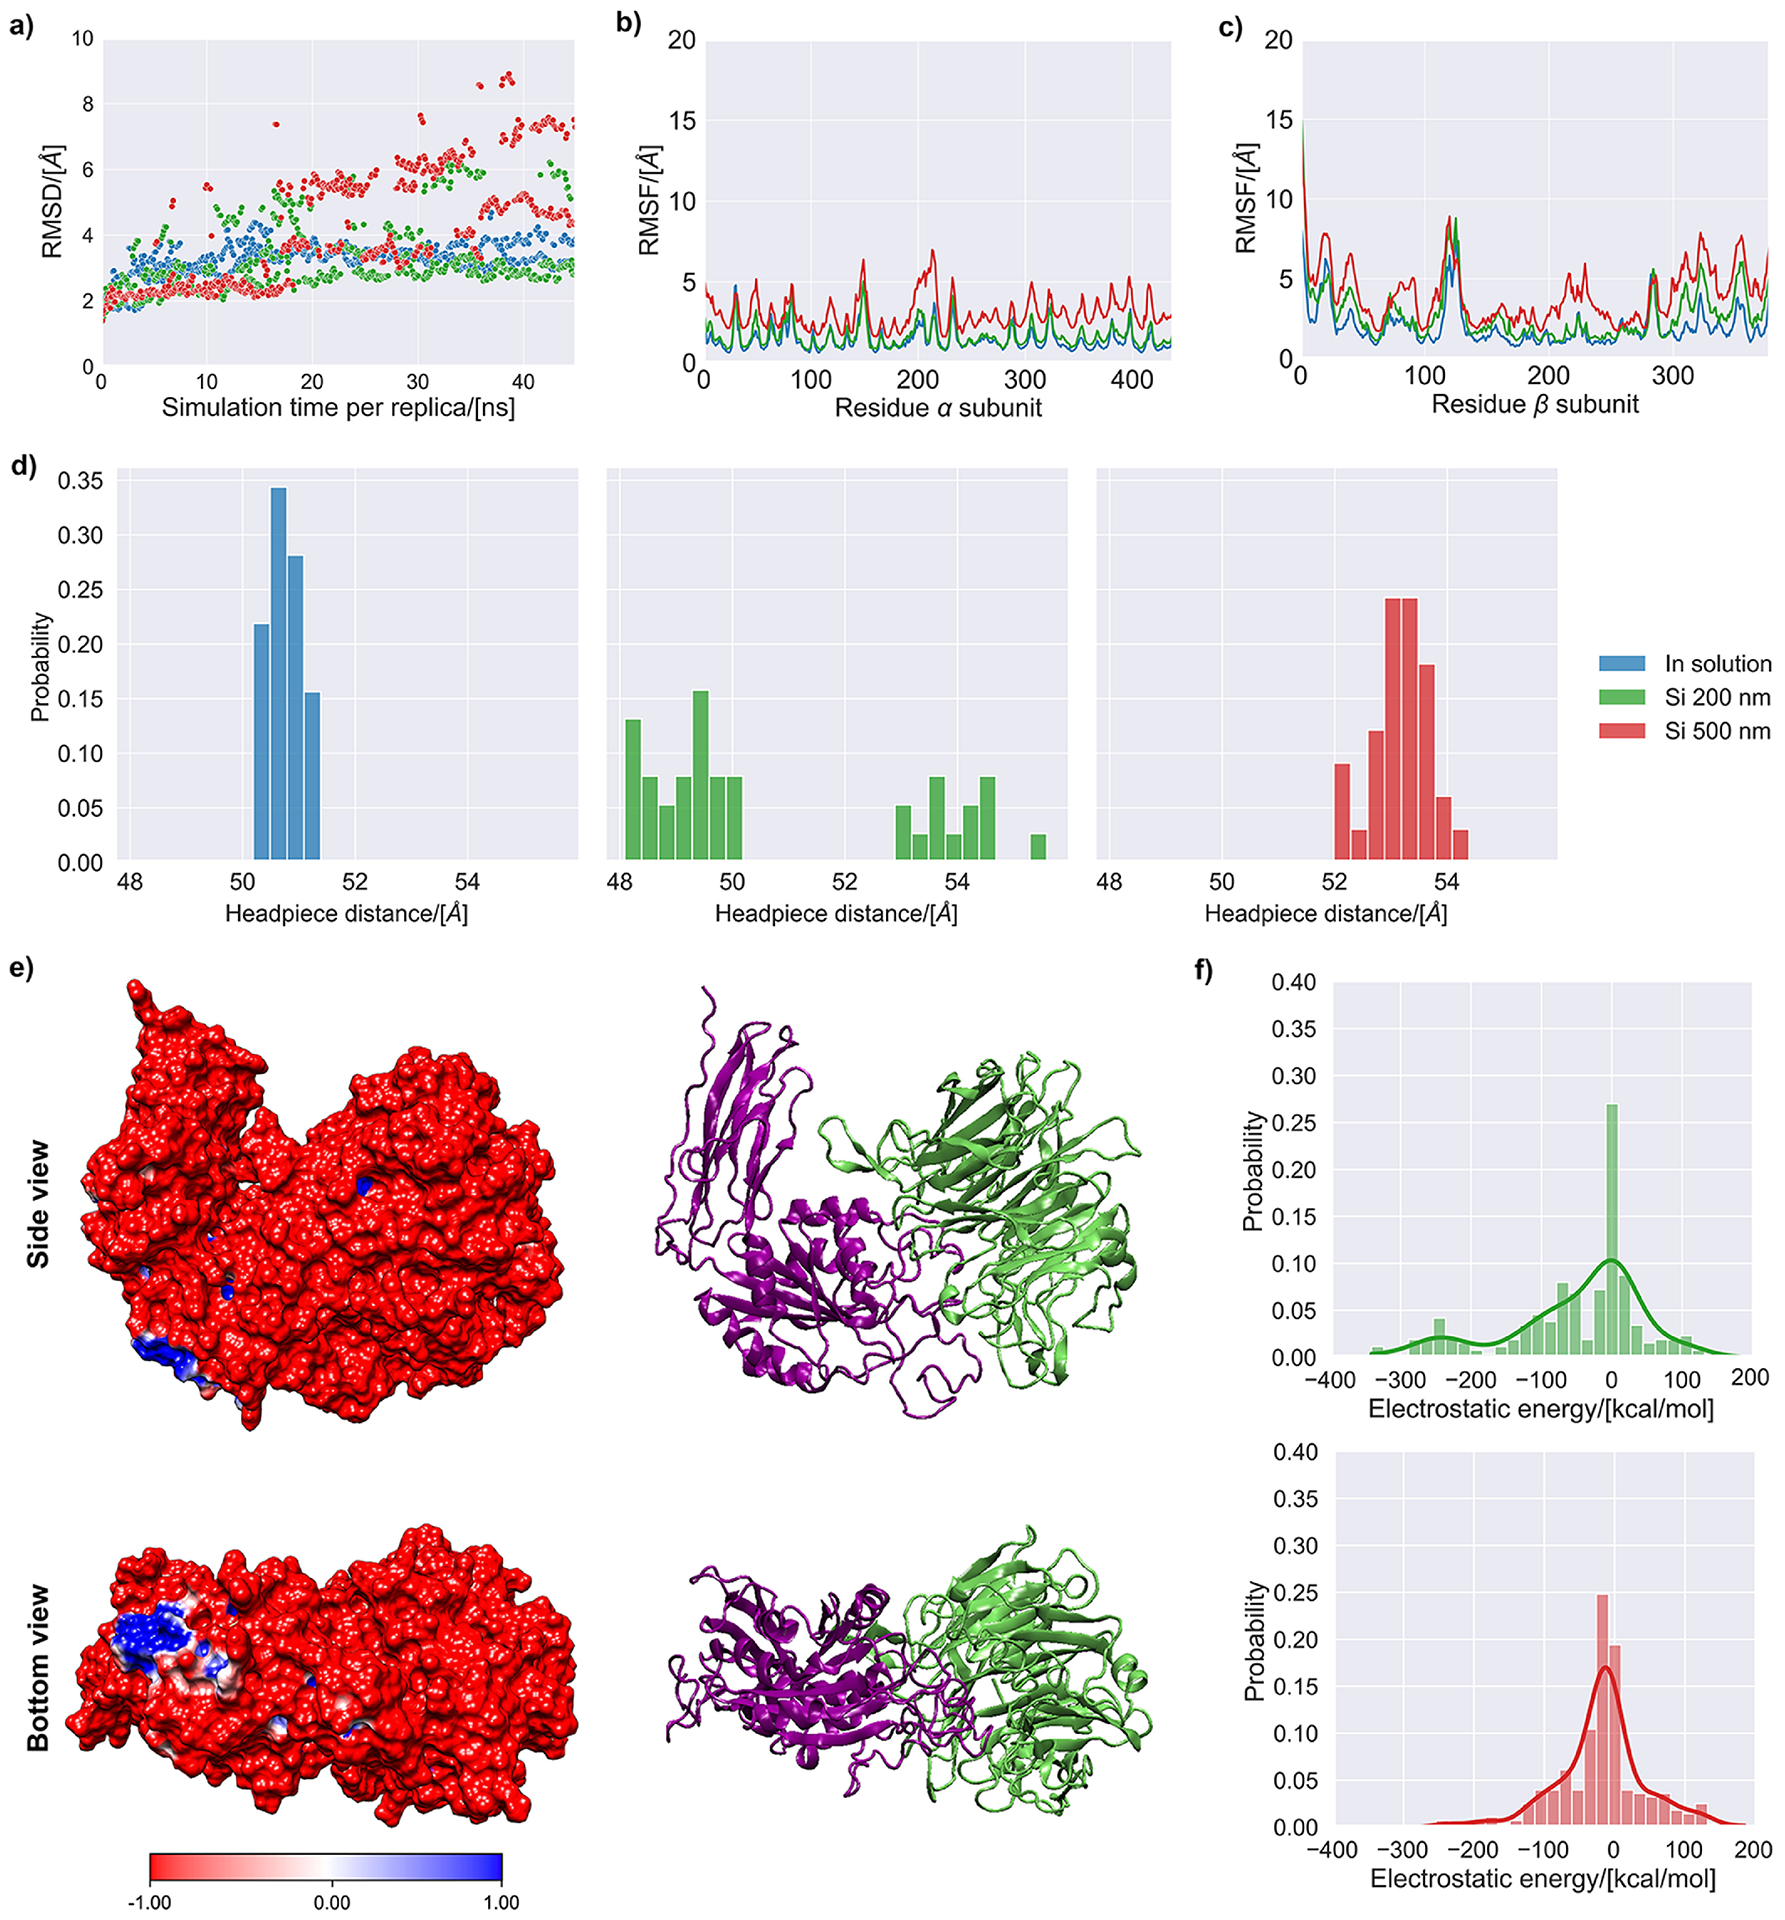
Figure 4 –

MD simulation results of the αVβ3 integrin subunit in aqueous solution (0.15 M NaCl) and in contact with silica surfaces of 200 and 500 nm. (a) Root mean square deviation of the backbone of the αVβ3 integrin for the accepted states during the simulation. (b) Root mean square fluctuations (RMSF) of the backbone of the α chain for the accepted states during the simulation. (c) Root mean square fluctuations (RMSF) of the backbone of the β chain for the accepted states during the simulation. (d) Histograms representing the headpiece distance for the accepted states collected during the last 2.5 ns of simulation. (e) Side and bottom views of the αVβ3 integrin’s molecular electrostatic potential map, with cartoon representation shown next to it for reference (lime color=α subunit, purple color=β subunit). (f) Histograms of the electrostatic and van der Waals energies for the interaction of the αVβ3 integrin with the silica surfaces representing nanoparticles of 200 and 500 nm. The continuous probability density curve is plotted the KDE method in the Seaborn library from Python.
