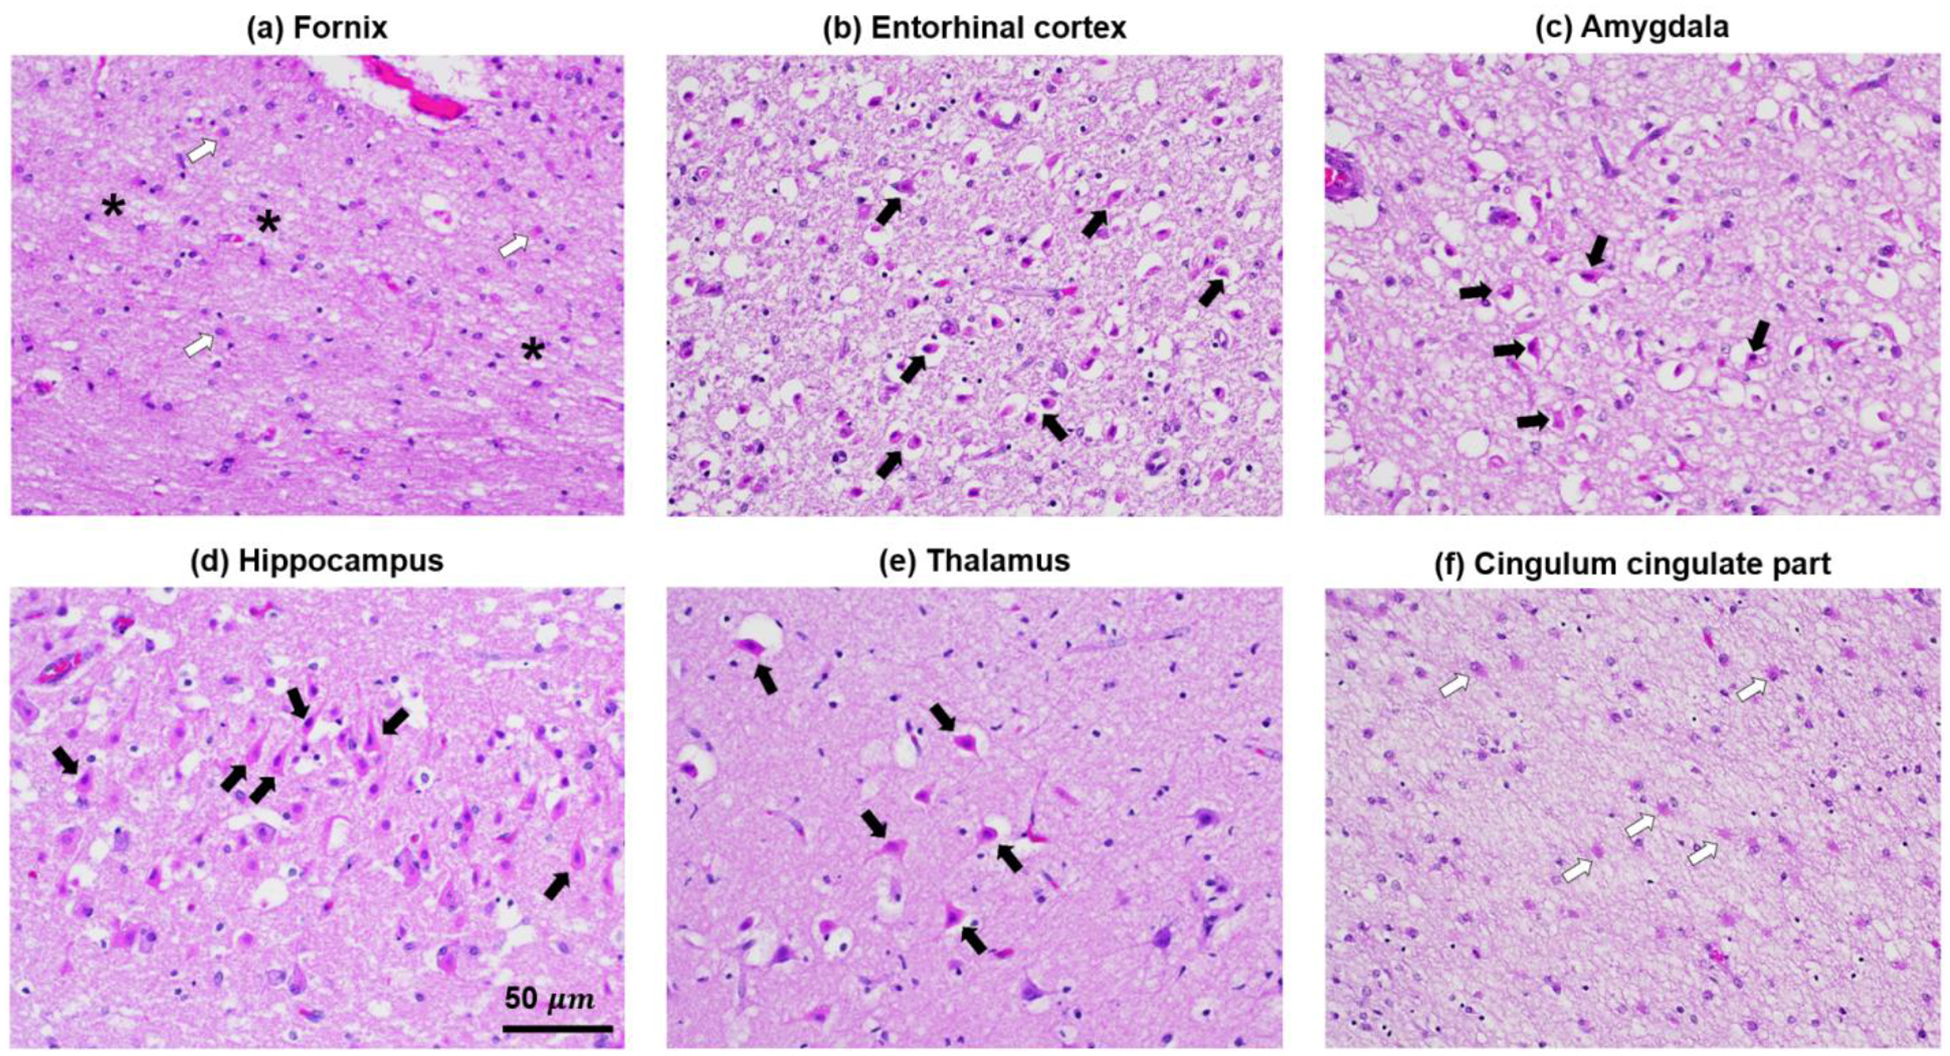
Figure 3.

Histopathologic evidence of HIE in the fornix, entorhinal cortex, amygdala, and hippocampus, thalamus, and cingulum cingulate part. All images are of hematoxylin and eosin-stained sections taken at 200x magnification. Black arrows in (b-e) designate examples of eosinophilic (anoxic) neurons in each image. White arrows in (a) and (f) designate examples of reactive astrocytes. Asterisks in (a) designate regions of tissue rarefaction. The scale bar in (d) applies to all images.
